British vs Puerto Rican No Vehicles in Household
COMPARE
British
Puerto Rican
No Vehicles in Household
No Vehicles in Household Comparison
British
Puerto Ricans
7.6%
NO VEHICLES IN HOUSEHOLD
100.0/ 100
METRIC RATING
27th/ 347
METRIC RANK
15.5%
NO VEHICLES IN HOUSEHOLD
0.0/ 100
METRIC RATING
309th/ 347
METRIC RANK
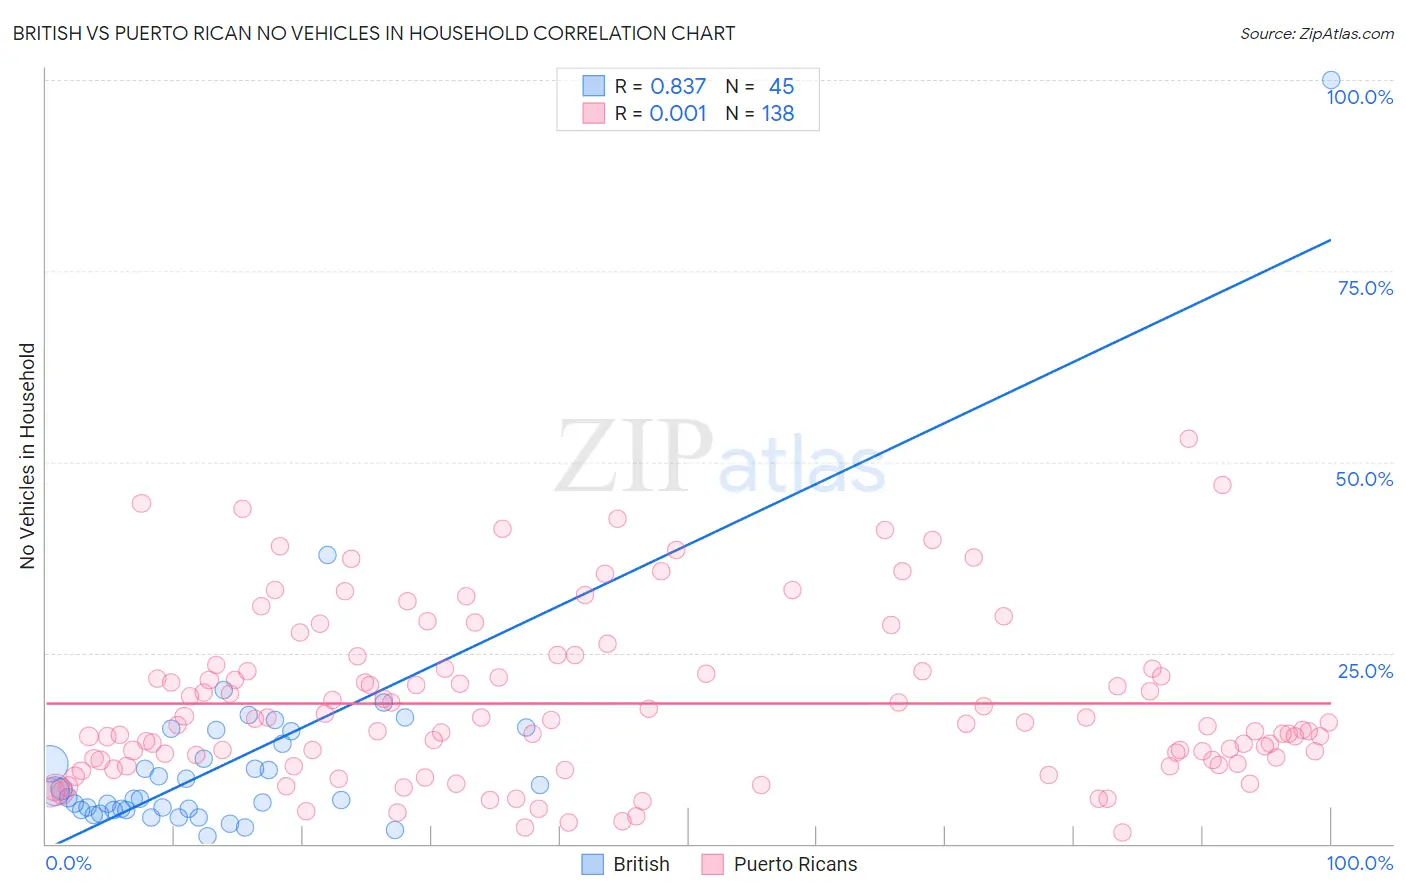
British vs Puerto Rican No Vehicles in Household Correlation Chart
The statistical analysis conducted on geographies consisting of 528,049,414 people shows a very strong positive correlation between the proportion of British and percentage of households with no vehicle available in the United States with a correlation coefficient (R) of 0.837 and weighted average of 7.6%. Similarly, the statistical analysis conducted on geographies consisting of 525,427,776 people shows no correlation between the proportion of Puerto Ricans and percentage of households with no vehicle available in the United States with a correlation coefficient (R) of 0.001 and weighted average of 15.5%, a difference of 104.0%.
No Vehicles in Household Correlation Summary
| Measurement | British | Puerto Rican |
| Minimum | 1.0% | 1.5% |
| Maximum | 100.0% | 53.0% |
| Range | 99.0% | 51.4% |
| Mean | 10.8% | 18.4% |
| Median | 6.0% | 15.6% |
| Interquartile 25% (IQ1) | 4.5% | 10.9% |
| Interquartile 75% (IQ3) | 13.9% | 22.8% |
| Interquartile Range (IQR) | 9.4% | 11.9% |
| Standard Deviation (Sample) | 15.1% | 10.8% |
| Standard Deviation (Population) | 15.0% | 10.8% |
Similar Demographics by No Vehicles in Household
Demographics Similar to British by No Vehicles in Household
In terms of no vehicles in household, the demographic groups most similar to British are Sri Lankan (7.6%, a difference of 0.050%), Samoan (7.6%, a difference of 0.55%), American (7.7%, a difference of 0.84%), Finnish (7.7%, a difference of 1.1%), and Native Hawaiian (7.7%, a difference of 1.3%).
| Demographics | Rating | Rank | No Vehicles in Household |
| Ottawa | 100.0 /100 | #20 | Exceptional 7.4% |
| Nepalese | 100.0 /100 | #21 | Exceptional 7.4% |
| Irish | 100.0 /100 | #22 | Exceptional 7.4% |
| French | 100.0 /100 | #23 | Exceptional 7.4% |
| Immigrants | Iraq | 100.0 /100 | #24 | Exceptional 7.5% |
| Yaqui | 100.0 /100 | #25 | Exceptional 7.5% |
| Sri Lankans | 100.0 /100 | #26 | Exceptional 7.6% |
| British | 100.0 /100 | #27 | Exceptional 7.6% |
| Samoans | 100.0 /100 | #28 | Exceptional 7.6% |
| Americans | 100.0 /100 | #29 | Exceptional 7.7% |
| Finns | 100.0 /100 | #30 | Exceptional 7.7% |
| Native Hawaiians | 100.0 /100 | #31 | Exceptional 7.7% |
| Malaysians | 100.0 /100 | #32 | Exceptional 7.7% |
| Immigrants | Taiwan | 100.0 /100 | #33 | Exceptional 7.7% |
| Immigrants | Vietnam | 100.0 /100 | #34 | Exceptional 7.7% |
Demographics Similar to Puerto Ricans by No Vehicles in Household
In terms of no vehicles in household, the demographic groups most similar to Puerto Ricans are Cape Verdean (15.6%, a difference of 0.56%), Immigrants from Israel (15.6%, a difference of 0.57%), U.S. Virgin Islander (15.4%, a difference of 0.65%), Immigrants from Haiti (15.4%, a difference of 0.69%), and Alaskan Athabascan (15.6%, a difference of 0.72%).
| Demographics | Rating | Rank | No Vehicles in Household |
| Haitians | 0.0 /100 | #302 | Tragic 14.9% |
| Immigrants | Western Africa | 0.0 /100 | #303 | Tragic 15.0% |
| Immigrants | Russia | 0.0 /100 | #304 | Tragic 15.1% |
| Immigrants | China | 0.0 /100 | #305 | Tragic 15.2% |
| Immigrants | Belize | 0.0 /100 | #306 | Tragic 15.4% |
| Immigrants | Haiti | 0.0 /100 | #307 | Tragic 15.4% |
| U.S. Virgin Islanders | 0.0 /100 | #308 | Tragic 15.4% |
| Puerto Ricans | 0.0 /100 | #309 | Tragic 15.5% |
| Cape Verdeans | 0.0 /100 | #310 | Tragic 15.6% |
| Immigrants | Israel | 0.0 /100 | #311 | Tragic 15.6% |
| Alaskan Athabascans | 0.0 /100 | #312 | Tragic 15.6% |
| Tohono O'odham | 0.0 /100 | #313 | Tragic 15.6% |
| Albanians | 0.0 /100 | #314 | Tragic 15.6% |
| Cypriots | 0.0 /100 | #315 | Tragic 15.7% |
| Ghanaians | 0.0 /100 | #316 | Tragic 16.4% |