Immigrants from Grenada vs Blackfeet 4 or more Vehicles in Household
COMPARE
Immigrants from Grenada
Blackfeet
4 or more Vehicles in Household
4 or more Vehicles in Household Comparison
Immigrants from Grenada
Blackfeet
2.7%
4 OR MORE VEHICLES IN HOUSEHOLD
0.0/ 100
METRIC RATING
347th/ 347
METRIC RANK
7.0%
4 OR MORE VEHICLES IN HOUSEHOLD
98.6/ 100
METRIC RATING
103rd/ 347
METRIC RANK
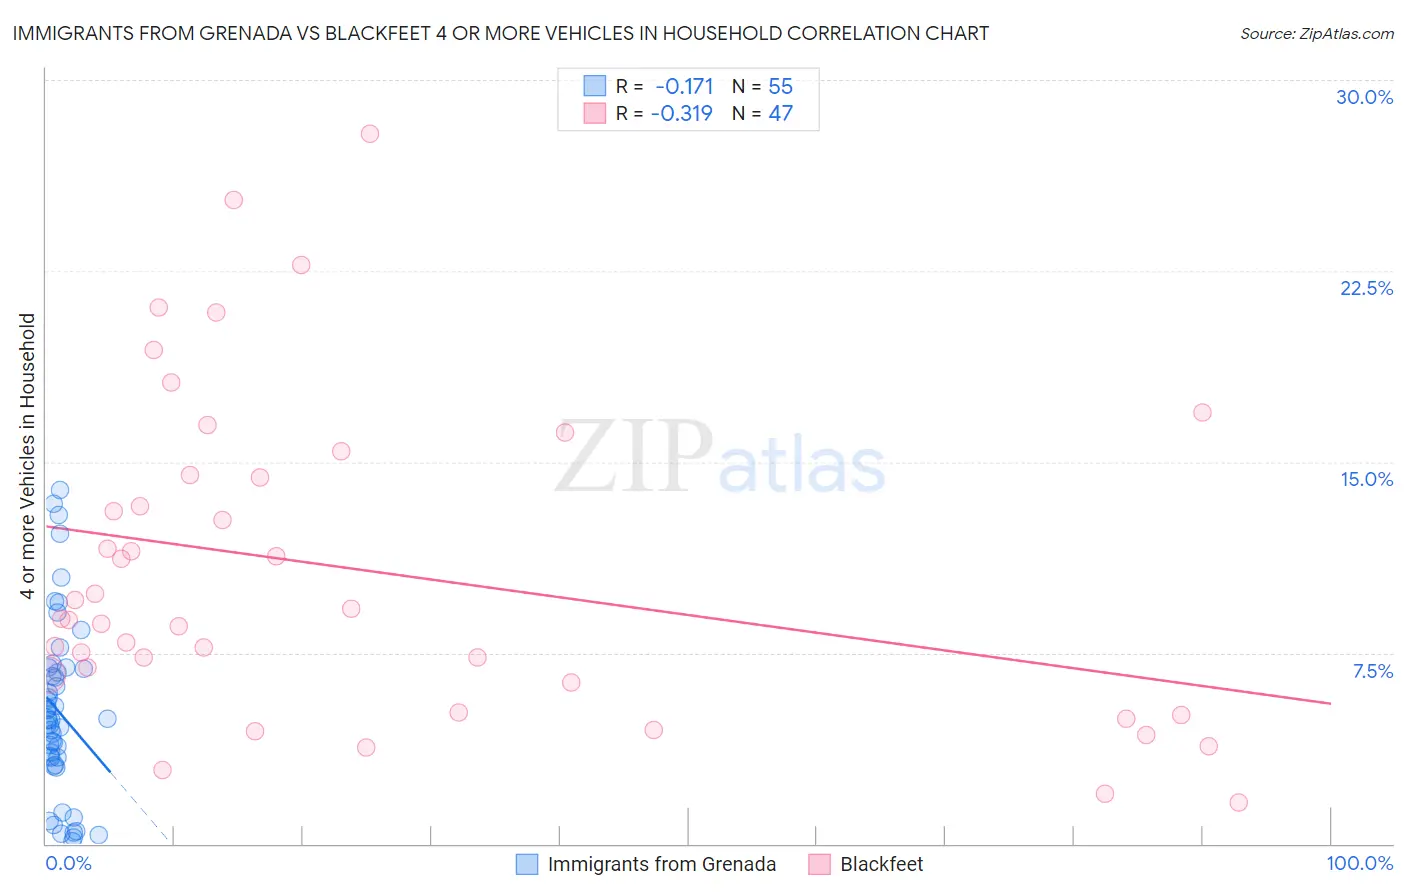
Immigrants from Grenada vs Blackfeet 4 or more Vehicles in Household Correlation Chart
The statistical analysis conducted on geographies consisting of 66,738,845 people shows a poor negative correlation between the proportion of Immigrants from Grenada and percentage of households with 4 or more vehicles available in the United States with a correlation coefficient (R) of -0.171 and weighted average of 2.7%. Similarly, the statistical analysis conducted on geographies consisting of 308,735,015 people shows a mild negative correlation between the proportion of Blackfeet and percentage of households with 4 or more vehicles available in the United States with a correlation coefficient (R) of -0.319 and weighted average of 7.0%, a difference of 156.2%.
4 or more Vehicles in Household Correlation Summary
| Measurement | Immigrants from Grenada | Blackfeet |
| Minimum | 0.11% | 1.6% |
| Maximum | 13.9% | 27.9% |
| Range | 13.8% | 26.3% |
| Mean | 5.2% | 10.7% |
| Median | 4.9% | 8.8% |
| Interquartile 25% (IQ1) | 3.4% | 6.3% |
| Interquartile 75% (IQ3) | 6.9% | 14.5% |
| Interquartile Range (IQR) | 3.5% | 8.2% |
| Standard Deviation (Sample) | 3.4% | 6.3% |
| Standard Deviation (Population) | 3.3% | 6.2% |
Similar Demographics by 4 or more Vehicles in Household
Demographics Similar to Immigrants from Grenada by 4 or more Vehicles in Household
In terms of 4 or more vehicles in household, the demographic groups most similar to Immigrants from Grenada are Immigrants from St. Vincent and the Grenadines (3.0%, a difference of 8.5%), Immigrants from Dominican Republic (3.3%, a difference of 19.4%), Immigrants from Guyana (3.4%, a difference of 24.2%), British West Indian (3.5%, a difference of 26.2%), and Guyanese (3.5%, a difference of 27.4%).
| Demographics | Rating | Rank | 4 or more Vehicles in Household |
| Immigrants | Albania | 0.0 /100 | #333 | Tragic 4.1% |
| Immigrants | Trinidad and Tobago | 0.0 /100 | #334 | Tragic 4.1% |
| Barbadians | 0.0 /100 | #335 | Tragic 3.9% |
| Immigrants | Bangladesh | 0.0 /100 | #336 | Tragic 3.9% |
| Vietnamese | 0.0 /100 | #337 | Tragic 3.9% |
| Immigrants | Cabo Verde | 0.0 /100 | #338 | Tragic 3.8% |
| Immigrants | Uzbekistan | 0.0 /100 | #339 | Tragic 3.6% |
| Immigrants | Barbados | 0.0 /100 | #340 | Tragic 3.6% |
| Dominicans | 0.0 /100 | #341 | Tragic 3.5% |
| Guyanese | 0.0 /100 | #342 | Tragic 3.5% |
| British West Indians | 0.0 /100 | #343 | Tragic 3.5% |
| Immigrants | Guyana | 0.0 /100 | #344 | Tragic 3.4% |
| Immigrants | Dominican Republic | 0.0 /100 | #345 | Tragic 3.3% |
| Immigrants | St. Vincent and the Grenadines | 0.0 /100 | #346 | Tragic 3.0% |
| Immigrants | Grenada | 0.0 /100 | #347 | Tragic 2.7% |
Demographics Similar to Blackfeet by 4 or more Vehicles in Household
In terms of 4 or more vehicles in household, the demographic groups most similar to Blackfeet are Asian (7.0%, a difference of 0.010%), Pakistani (7.0%, a difference of 0.080%), Taiwanese (7.0%, a difference of 0.15%), Seminole (7.0%, a difference of 0.22%), and Hmong (7.0%, a difference of 0.48%).
| Demographics | Rating | Rank | 4 or more Vehicles in Household |
| Central Americans | 99.3 /100 | #96 | Exceptional 7.1% |
| Celtics | 99.1 /100 | #97 | Exceptional 7.1% |
| Irish | 99.0 /100 | #98 | Exceptional 7.1% |
| Seminole | 98.8 /100 | #99 | Exceptional 7.0% |
| Taiwanese | 98.7 /100 | #100 | Exceptional 7.0% |
| Pakistanis | 98.7 /100 | #101 | Exceptional 7.0% |
| Asians | 98.6 /100 | #102 | Exceptional 7.0% |
| Blackfeet | 98.6 /100 | #103 | Exceptional 7.0% |
| Hmong | 98.3 /100 | #104 | Exceptional 7.0% |
| German Russians | 98.3 /100 | #105 | Exceptional 7.0% |
| Guatemalans | 98.1 /100 | #106 | Exceptional 7.0% |
| Nicaraguans | 98.0 /100 | #107 | Exceptional 7.0% |
| French | 97.7 /100 | #108 | Exceptional 6.9% |
| Filipinos | 97.6 /100 | #109 | Exceptional 6.9% |
| Immigrants | Thailand | 97.0 /100 | #110 | Exceptional 6.9% |