Cheyenne vs Slovak 1 or more Vehicles in Household
COMPARE
Cheyenne
Slovak
1 or more Vehicles in Household
1 or more Vehicles in Household Comparison
Cheyenne
Slovaks
88.7%
1 OR MORE VEHICLES IN HOUSEHOLD
5.7/ 100
METRIC RATING
226th/ 347
METRIC RANK
91.9%
1 OR MORE VEHICLES IN HOUSEHOLD
99.8/ 100
METRIC RATING
60th/ 347
METRIC RANK
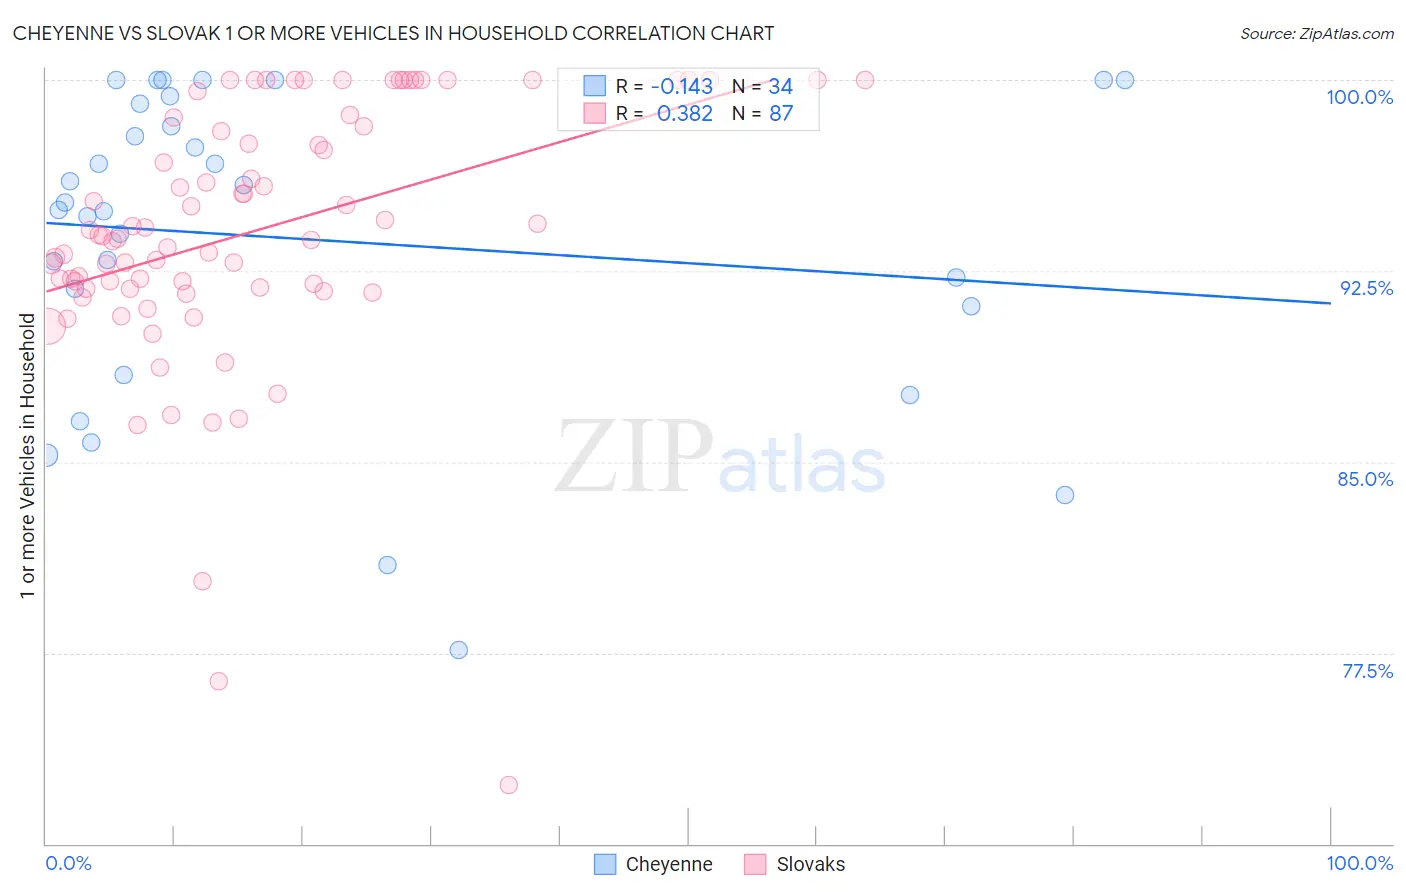
Cheyenne vs Slovak 1 or more Vehicles in Household Correlation Chart
The statistical analysis conducted on geographies consisting of 80,710,429 people shows a poor negative correlation between the proportion of Cheyenne and percentage of households with 1 or more vehicles available in the United States with a correlation coefficient (R) of -0.143 and weighted average of 88.7%. Similarly, the statistical analysis conducted on geographies consisting of 397,723,314 people shows a mild positive correlation between the proportion of Slovaks and percentage of households with 1 or more vehicles available in the United States with a correlation coefficient (R) of 0.382 and weighted average of 91.9%, a difference of 3.6%.
1 or more Vehicles in Household Correlation Summary
| Measurement | Cheyenne | Slovak |
| Minimum | 77.6% | 72.3% |
| Maximum | 100.0% | 100.0% |
| Range | 22.4% | 27.7% |
| Mean | 93.8% | 94.1% |
| Median | 95.1% | 93.8% |
| Interquartile 25% (IQ1) | 91.1% | 91.8% |
| Interquartile 75% (IQ3) | 99.1% | 98.5% |
| Interquartile Range (IQR) | 7.9% | 6.7% |
| Standard Deviation (Sample) | 6.0% | 5.2% |
| Standard Deviation (Population) | 6.0% | 5.1% |
Similar Demographics by 1 or more Vehicles in Household
Demographics Similar to Cheyenne by 1 or more Vehicles in Household
In terms of 1 or more vehicles in household, the demographic groups most similar to Cheyenne are Ute (88.7%, a difference of 0.0%), Immigrants from Norway (88.7%, a difference of 0.010%), Immigrants from Romania (88.7%, a difference of 0.020%), Cree (88.7%, a difference of 0.030%), and Immigrants from Hong Kong (88.7%, a difference of 0.040%).
| Demographics | Rating | Rank | 1 or more Vehicles in Household |
| Immigrants | Guatemala | 8.6 /100 | #219 | Tragic 88.9% |
| Immigrants | Zaire | 8.1 /100 | #220 | Tragic 88.8% |
| Peruvians | 7.9 /100 | #221 | Tragic 88.8% |
| Uruguayans | 7.0 /100 | #222 | Tragic 88.8% |
| Immigrants | South America | 7.0 /100 | #223 | Tragic 88.8% |
| Immigrants | Hong Kong | 6.2 /100 | #224 | Tragic 88.7% |
| Cree | 6.0 /100 | #225 | Tragic 88.7% |
| Cheyenne | 5.7 /100 | #226 | Tragic 88.7% |
| Ute | 5.6 /100 | #227 | Tragic 88.7% |
| Immigrants | Norway | 5.5 /100 | #228 | Tragic 88.7% |
| Immigrants | Romania | 5.4 /100 | #229 | Tragic 88.7% |
| Immigrants | Sierra Leone | 5.2 /100 | #230 | Tragic 88.7% |
| Russians | 5.0 /100 | #231 | Tragic 88.7% |
| Immigrants | Japan | 4.9 /100 | #232 | Tragic 88.7% |
| Houma | 4.8 /100 | #233 | Tragic 88.6% |
Demographics Similar to Slovaks by 1 or more Vehicles in Household
In terms of 1 or more vehicles in household, the demographic groups most similar to Slovaks are Immigrants from India (91.9%, a difference of 0.010%), Thai (91.9%, a difference of 0.020%), Venezuelan (91.9%, a difference of 0.030%), Immigrants from Mexico (91.9%, a difference of 0.040%), and Chinese (91.9%, a difference of 0.040%).
| Demographics | Rating | Rank | 1 or more Vehicles in Household |
| Hawaiians | 99.9 /100 | #53 | Exceptional 92.0% |
| Slovenes | 99.9 /100 | #54 | Exceptional 92.0% |
| Immigrants | Afghanistan | 99.9 /100 | #55 | Exceptional 92.0% |
| Immigrants | Venezuela | 99.9 /100 | #56 | Exceptional 92.0% |
| Iraqis | 99.8 /100 | #57 | Exceptional 91.9% |
| Immigrants | Mexico | 99.8 /100 | #58 | Exceptional 91.9% |
| Venezuelans | 99.8 /100 | #59 | Exceptional 91.9% |
| Slovaks | 99.8 /100 | #60 | Exceptional 91.9% |
| Immigrants | India | 99.8 /100 | #61 | Exceptional 91.9% |
| Thais | 99.8 /100 | #62 | Exceptional 91.9% |
| Chinese | 99.8 /100 | #63 | Exceptional 91.9% |
| Croatians | 99.8 /100 | #64 | Exceptional 91.9% |
| Immigrants | Laos | 99.8 /100 | #65 | Exceptional 91.8% |
| Canadians | 99.8 /100 | #66 | Exceptional 91.8% |
| Spaniards | 99.8 /100 | #67 | Exceptional 91.8% |