Carpatho Rusyn vs Immigrants from Honduras No Vehicles in Household
COMPARE
Carpatho Rusyn
Immigrants from Honduras
No Vehicles in Household
No Vehicles in Household Comparison
Carpatho Rusyns
Immigrants from Honduras
10.7%
NO VEHICLES IN HOUSEHOLD
32.1/ 100
METRIC RATING
192nd/ 347
METRIC RANK
11.8%
NO VEHICLES IN HOUSEHOLD
2.1/ 100
METRIC RATING
245th/ 347
METRIC RANK
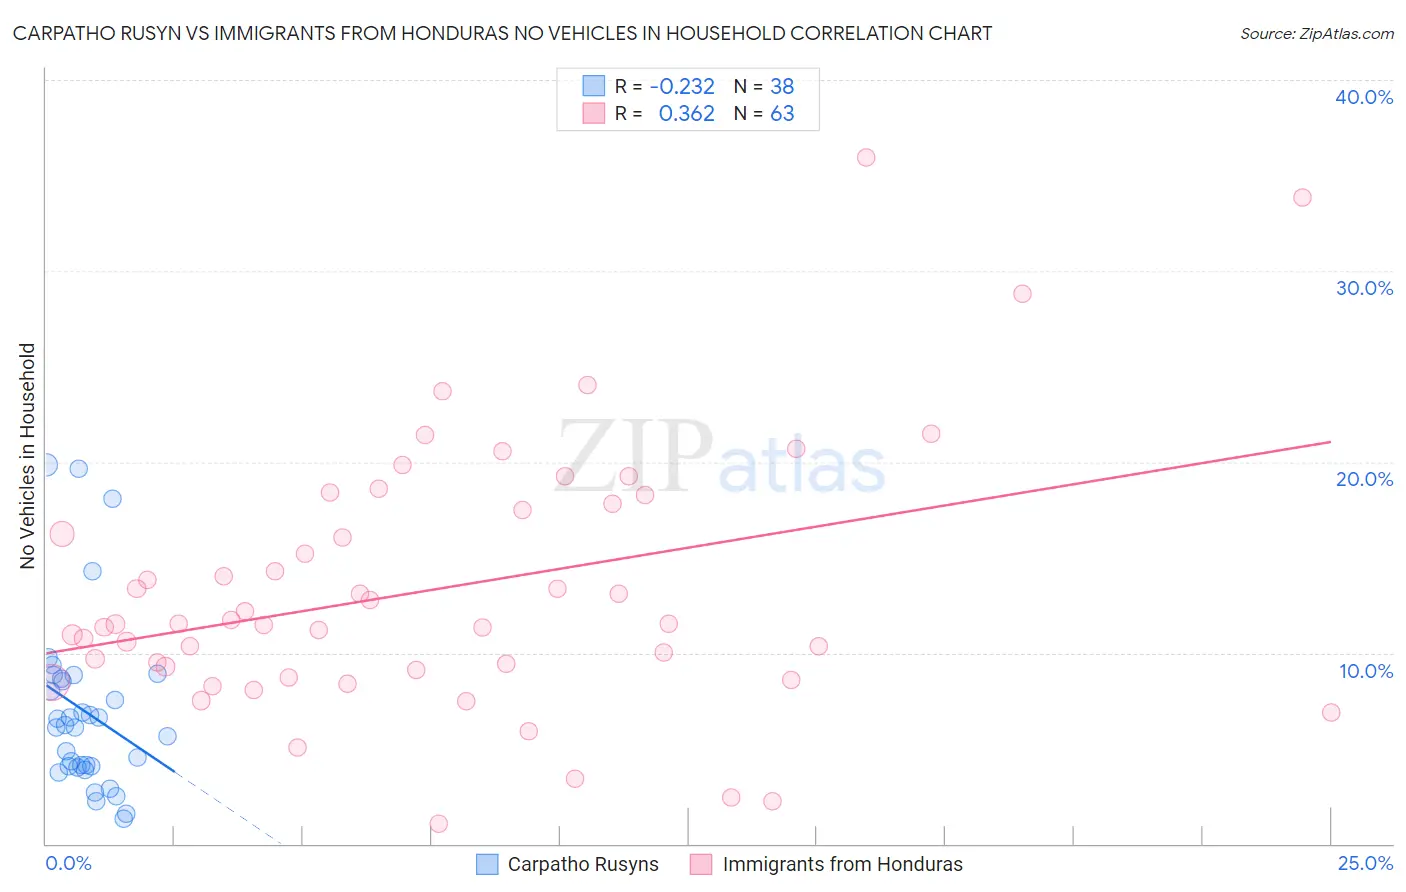
Carpatho Rusyn vs Immigrants from Honduras No Vehicles in Household Correlation Chart
The statistical analysis conducted on geographies consisting of 58,857,329 people shows a weak negative correlation between the proportion of Carpatho Rusyns and percentage of households with no vehicle available in the United States with a correlation coefficient (R) of -0.232 and weighted average of 10.7%. Similarly, the statistical analysis conducted on geographies consisting of 322,146,811 people shows a mild positive correlation between the proportion of Immigrants from Honduras and percentage of households with no vehicle available in the United States with a correlation coefficient (R) of 0.362 and weighted average of 11.8%, a difference of 10.2%.
No Vehicles in Household Correlation Summary
| Measurement | Carpatho Rusyn | Immigrants from Honduras |
| Minimum | 1.3% | 1.0% |
| Maximum | 19.8% | 35.9% |
| Range | 18.5% | 34.9% |
| Mean | 6.9% | 13.3% |
| Median | 6.2% | 11.5% |
| Interquartile 25% (IQ1) | 4.0% | 9.1% |
| Interquartile 75% (IQ3) | 8.6% | 17.8% |
| Interquartile Range (IQR) | 4.6% | 8.7% |
| Standard Deviation (Sample) | 4.5% | 6.9% |
| Standard Deviation (Population) | 4.5% | 6.8% |
Similar Demographics by No Vehicles in Household
Demographics Similar to Carpatho Rusyns by No Vehicles in Household
In terms of no vehicles in household, the demographic groups most similar to Carpatho Rusyns are Immigrants from Northern Europe (10.7%, a difference of 0.14%), Immigrants from North Macedonia (10.6%, a difference of 0.38%), Immigrants from Eritrea (10.6%, a difference of 0.61%), Ukrainian (10.7%, a difference of 0.64%), and Immigrants from Armenia (10.6%, a difference of 0.79%).
| Demographics | Rating | Rank | No Vehicles in Household |
| South Americans | 41.9 /100 | #185 | Average 10.5% |
| German Russians | 40.6 /100 | #186 | Average 10.5% |
| Immigrants | Poland | 38.4 /100 | #187 | Fair 10.6% |
| Immigrants | Armenia | 37.5 /100 | #188 | Fair 10.6% |
| Immigrants | Eritrea | 36.3 /100 | #189 | Fair 10.6% |
| Immigrants | North Macedonia | 34.6 /100 | #190 | Fair 10.6% |
| Immigrants | Northern Europe | 33.1 /100 | #191 | Fair 10.7% |
| Carpatho Rusyns | 32.1 /100 | #192 | Fair 10.7% |
| Ukrainians | 28.0 /100 | #193 | Fair 10.7% |
| Pueblo | 27.0 /100 | #194 | Fair 10.8% |
| Immigrants | Brazil | 26.3 /100 | #195 | Fair 10.8% |
| Central Americans | 24.3 /100 | #196 | Fair 10.8% |
| Shoshone | 24.1 /100 | #197 | Fair 10.8% |
| Immigrants | Sweden | 22.9 /100 | #198 | Fair 10.8% |
| Immigrants | Asia | 21.3 /100 | #199 | Fair 10.9% |
Demographics Similar to Immigrants from Honduras by No Vehicles in Household
In terms of no vehicles in household, the demographic groups most similar to Immigrants from Honduras are Menominee (11.8%, a difference of 0.17%), Immigrants from Portugal (11.7%, a difference of 0.19%), Immigrants from Czechoslovakia (11.8%, a difference of 0.22%), Immigrants from Belgium (11.8%, a difference of 0.23%), and Immigrants from Nigeria (11.8%, a difference of 0.26%).
| Demographics | Rating | Rank | No Vehicles in Household |
| Russians | 3.2 /100 | #238 | Tragic 11.6% |
| Taiwanese | 2.8 /100 | #239 | Tragic 11.7% |
| Immigrants | Immigrants | 2.7 /100 | #240 | Tragic 11.7% |
| Eastern Europeans | 2.7 /100 | #241 | Tragic 11.7% |
| Turks | 2.6 /100 | #242 | Tragic 11.7% |
| Cheyenne | 2.4 /100 | #243 | Tragic 11.7% |
| Immigrants | Portugal | 2.2 /100 | #244 | Tragic 11.7% |
| Immigrants | Honduras | 2.1 /100 | #245 | Tragic 11.8% |
| Menominee | 2.0 /100 | #246 | Tragic 11.8% |
| Immigrants | Czechoslovakia | 2.0 /100 | #247 | Tragic 11.8% |
| Immigrants | Belgium | 1.9 /100 | #248 | Tragic 11.8% |
| Immigrants | Nigeria | 1.9 /100 | #249 | Tragic 11.8% |
| Paiute | 1.8 /100 | #250 | Tragic 11.8% |
| Blacks/African Americans | 1.6 /100 | #251 | Tragic 11.9% |
| Immigrants | Serbia | 1.5 /100 | #252 | Tragic 11.9% |