Bermudan vs Native Hawaiian 2 or more Vehicles in Household
COMPARE
Bermudan
Native Hawaiian
2 or more Vehicles in Household
2 or more Vehicles in Household Comparison
Bermudans
Native Hawaiians
50.6%
2 OR MORE VEHICLES IN HOUSEHOLD
0.0/ 100
METRIC RATING
294th/ 347
METRIC RANK
61.4%
2 OR MORE VEHICLES IN HOUSEHOLD
100.0/ 100
METRIC RATING
16th/ 347
METRIC RANK
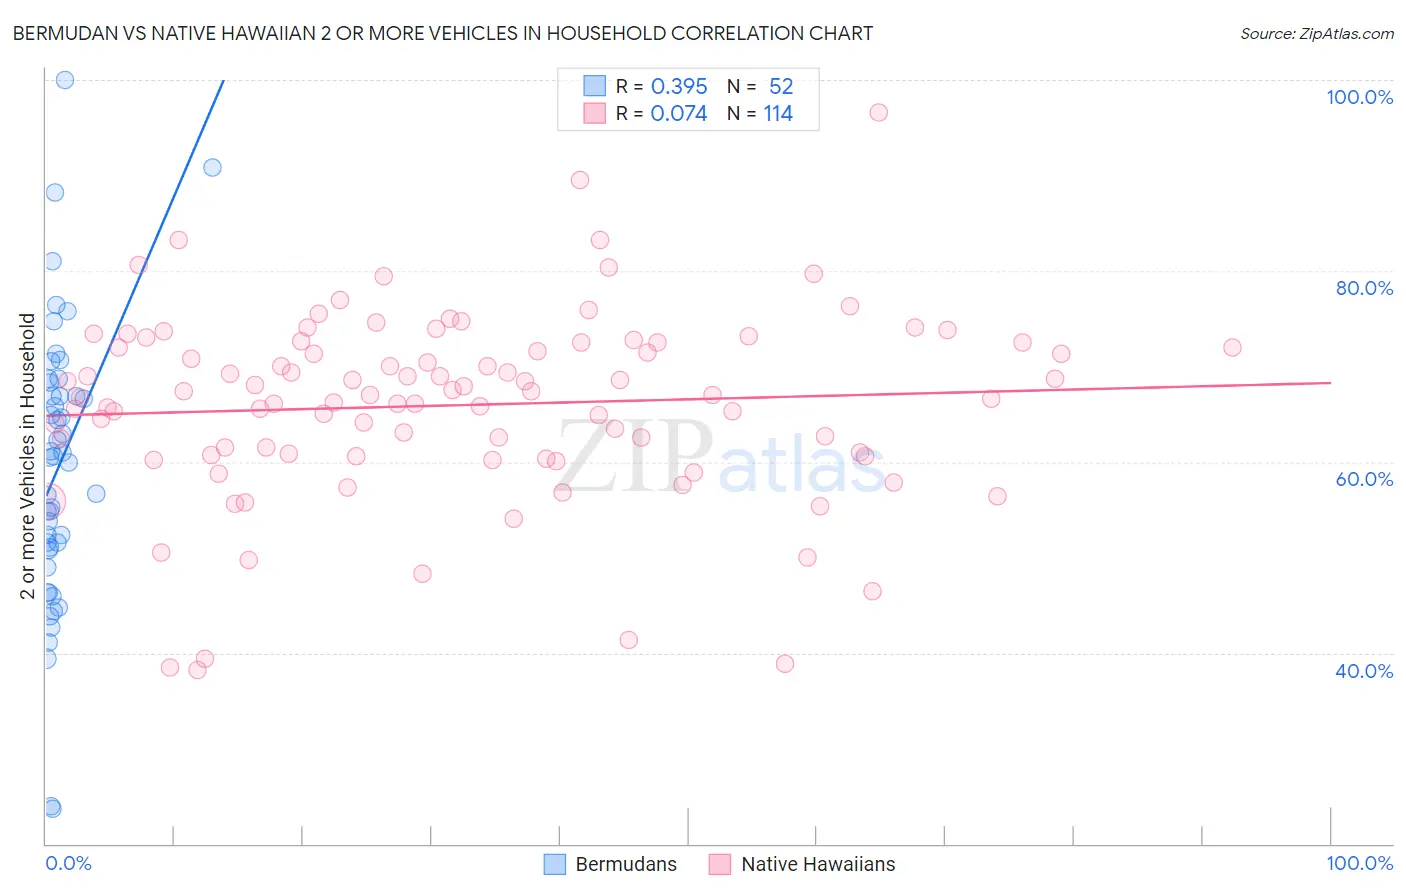
Bermudan vs Native Hawaiian 2 or more Vehicles in Household Correlation Chart
The statistical analysis conducted on geographies consisting of 55,716,623 people shows a mild positive correlation between the proportion of Bermudans and percentage of households with 2 or more vehicles available in the United States with a correlation coefficient (R) of 0.395 and weighted average of 50.6%. Similarly, the statistical analysis conducted on geographies consisting of 331,863,801 people shows a slight positive correlation between the proportion of Native Hawaiians and percentage of households with 2 or more vehicles available in the United States with a correlation coefficient (R) of 0.074 and weighted average of 61.4%, a difference of 21.4%.
2 or more Vehicles in Household Correlation Summary
| Measurement | Bermudan | Native Hawaiian |
| Minimum | 23.7% | 38.2% |
| Maximum | 100.0% | 96.6% |
| Range | 76.3% | 58.3% |
| Mean | 59.5% | 65.9% |
| Median | 60.5% | 67.0% |
| Interquartile 25% (IQ1) | 50.9% | 60.8% |
| Interquartile 75% (IQ3) | 67.6% | 72.5% |
| Interquartile Range (IQR) | 16.8% | 11.7% |
| Standard Deviation (Sample) | 14.7% | 9.9% |
| Standard Deviation (Population) | 14.6% | 9.9% |
Similar Demographics by 2 or more Vehicles in Household
Demographics Similar to Bermudans by 2 or more Vehicles in Household
In terms of 2 or more vehicles in household, the demographic groups most similar to Bermudans are Cypriot (50.6%, a difference of 0.070%), Immigrants from Somalia (50.5%, a difference of 0.11%), Immigrants from Spain (50.4%, a difference of 0.38%), Paraguayan (50.3%, a difference of 0.51%), and Immigrants from Morocco (50.3%, a difference of 0.54%).
| Demographics | Rating | Rank | 2 or more Vehicles in Household |
| Immigrants | Serbia | 0.1 /100 | #287 | Tragic 51.3% |
| Okinawans | 0.1 /100 | #288 | Tragic 51.2% |
| Somalis | 0.0 /100 | #289 | Tragic 51.1% |
| Immigrants | Panama | 0.0 /100 | #290 | Tragic 51.1% |
| Belizeans | 0.0 /100 | #291 | Tragic 51.0% |
| Immigrants | Ukraine | 0.0 /100 | #292 | Tragic 50.9% |
| Blacks/African Americans | 0.0 /100 | #293 | Tragic 50.9% |
| Bermudans | 0.0 /100 | #294 | Tragic 50.6% |
| Cypriots | 0.0 /100 | #295 | Tragic 50.6% |
| Immigrants | Somalia | 0.0 /100 | #296 | Tragic 50.5% |
| Immigrants | Spain | 0.0 /100 | #297 | Tragic 50.4% |
| Paraguayans | 0.0 /100 | #298 | Tragic 50.3% |
| Immigrants | Morocco | 0.0 /100 | #299 | Tragic 50.3% |
| Immigrants | Russia | 0.0 /100 | #300 | Tragic 50.3% |
| Immigrants | Greece | 0.0 /100 | #301 | Tragic 50.2% |
Demographics Similar to Native Hawaiians by 2 or more Vehicles in Household
In terms of 2 or more vehicles in household, the demographic groups most similar to Native Hawaiians are Nepalese (61.4%, a difference of 0.020%), Basque (61.4%, a difference of 0.070%), European (61.4%, a difference of 0.080%), Czech (61.5%, a difference of 0.11%), and Samoan (61.5%, a difference of 0.16%).
| Demographics | Rating | Rank | 2 or more Vehicles in Household |
| Swedes | 100.0 /100 | #9 | Exceptional 61.8% |
| Mexicans | 100.0 /100 | #10 | Exceptional 61.7% |
| Dutch | 100.0 /100 | #11 | Exceptional 61.6% |
| Germans | 100.0 /100 | #12 | Exceptional 61.6% |
| Samoans | 100.0 /100 | #13 | Exceptional 61.5% |
| Czechs | 100.0 /100 | #14 | Exceptional 61.5% |
| Nepalese | 100.0 /100 | #15 | Exceptional 61.4% |
| Native Hawaiians | 100.0 /100 | #16 | Exceptional 61.4% |
| Basques | 100.0 /100 | #17 | Exceptional 61.4% |
| Europeans | 100.0 /100 | #18 | Exceptional 61.4% |
| Scottish | 100.0 /100 | #19 | Exceptional 61.2% |
| Sri Lankans | 100.0 /100 | #20 | Exceptional 61.0% |
| Koreans | 100.0 /100 | #21 | Exceptional 61.0% |
| Swiss | 100.0 /100 | #22 | Exceptional 61.0% |
| Scotch-Irish | 100.0 /100 | #23 | Exceptional 60.9% |