Cambodian vs Polish 1 or more Vehicles in Household
COMPARE
Cambodian
Polish
1 or more Vehicles in Household
1 or more Vehicles in Household Comparison
Cambodians
Poles
89.2%
1 OR MORE VEHICLES IN HOUSEHOLD
18.9/ 100
METRIC RATING
203rd/ 347
METRIC RANK
91.7%
1 OR MORE VEHICLES IN HOUSEHOLD
99.7/ 100
METRIC RATING
71st/ 347
METRIC RANK
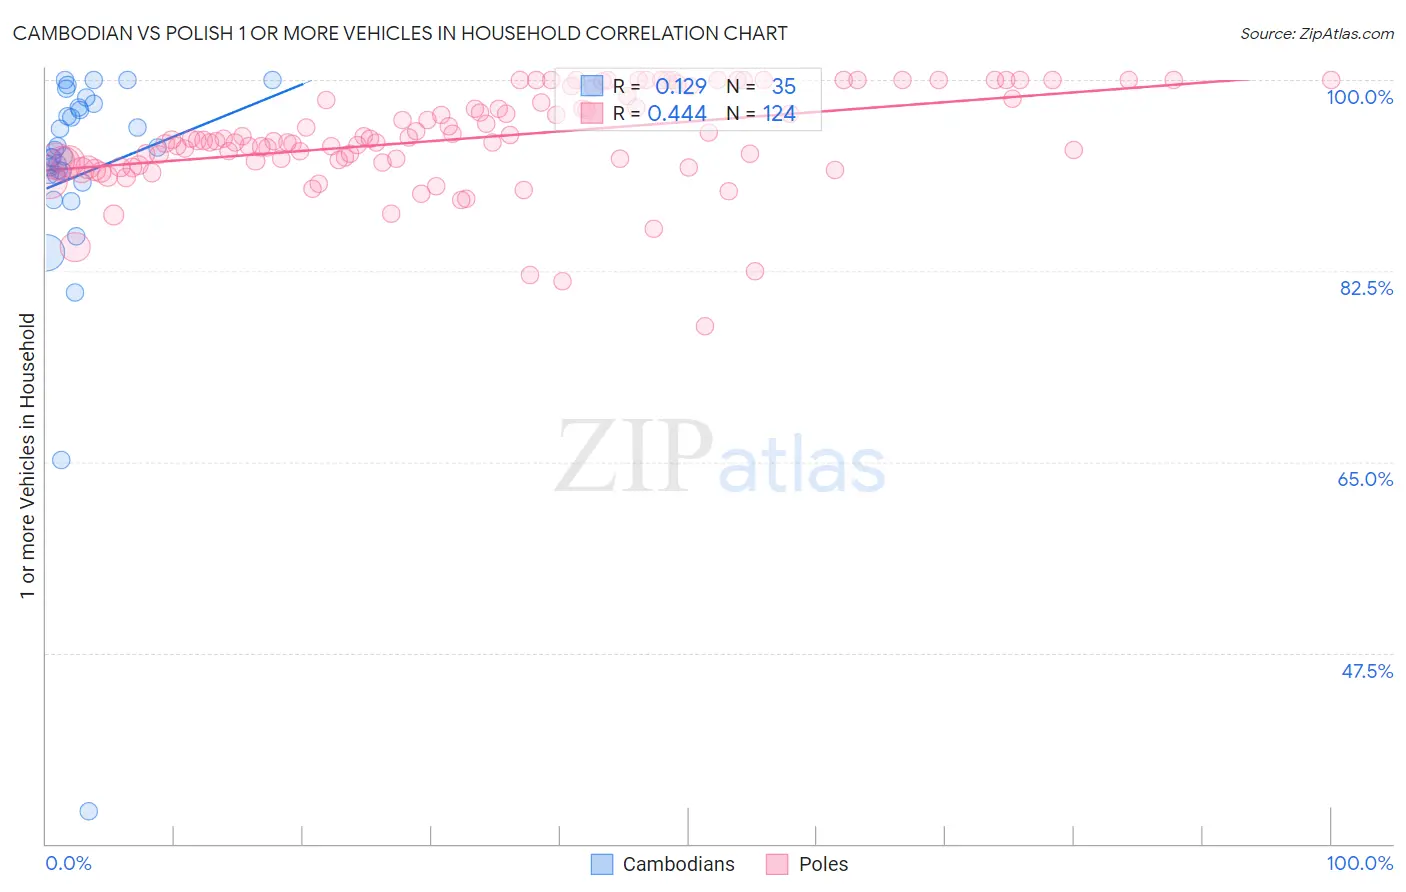
Cambodian vs Polish 1 or more Vehicles in Household Correlation Chart
The statistical analysis conducted on geographies consisting of 102,492,844 people shows a poor positive correlation between the proportion of Cambodians and percentage of households with 1 or more vehicles available in the United States with a correlation coefficient (R) of 0.129 and weighted average of 89.2%. Similarly, the statistical analysis conducted on geographies consisting of 560,073,045 people shows a moderate positive correlation between the proportion of Poles and percentage of households with 1 or more vehicles available in the United States with a correlation coefficient (R) of 0.444 and weighted average of 91.7%, a difference of 2.8%.
1 or more Vehicles in Household Correlation Summary
| Measurement | Cambodian | Polish |
| Minimum | 33.0% | 77.5% |
| Maximum | 100.0% | 100.0% |
| Range | 67.0% | 22.5% |
| Mean | 91.3% | 94.7% |
| Median | 93.0% | 94.4% |
| Interquartile 25% (IQ1) | 91.3% | 92.5% |
| Interquartile 75% (IQ3) | 97.5% | 98.4% |
| Interquartile Range (IQR) | 6.2% | 5.9% |
| Standard Deviation (Sample) | 12.2% | 4.4% |
| Standard Deviation (Population) | 12.0% | 4.4% |
Similar Demographics by 1 or more Vehicles in Household
Demographics Similar to Cambodians by 1 or more Vehicles in Household
In terms of 1 or more vehicles in household, the demographic groups most similar to Cambodians are Iroquois (89.2%, a difference of 0.020%), Romanian (89.2%, a difference of 0.020%), Guatemalan (89.2%, a difference of 0.030%), Immigrants from Western Europe (89.2%, a difference of 0.040%), and Central American (89.2%, a difference of 0.060%).
| Demographics | Rating | Rank | 1 or more Vehicles in Household |
| Crow | 24.3 /100 | #196 | Fair 89.3% |
| Immigrants | Sweden | 23.6 /100 | #197 | Fair 89.3% |
| Pennsylvania Germans | 22.9 /100 | #198 | Fair 89.3% |
| Immigrants | Asia | 22.8 /100 | #199 | Fair 89.3% |
| Central Americans | 21.4 /100 | #200 | Fair 89.2% |
| Immigrants | Western Europe | 20.5 /100 | #201 | Fair 89.2% |
| Iroquois | 19.8 /100 | #202 | Poor 89.2% |
| Cambodians | 18.9 /100 | #203 | Poor 89.2% |
| Romanians | 18.2 /100 | #204 | Poor 89.2% |
| Guatemalans | 17.8 /100 | #205 | Poor 89.2% |
| Apache | 16.2 /100 | #206 | Poor 89.1% |
| Immigrants | Denmark | 14.8 /100 | #207 | Poor 89.1% |
| Immigrants | Chile | 14.4 /100 | #208 | Poor 89.1% |
| Immigrants | Italy | 14.0 /100 | #209 | Poor 89.1% |
| Dutch West Indians | 13.5 /100 | #210 | Poor 89.0% |
Demographics Similar to Poles by 1 or more Vehicles in Household
In terms of 1 or more vehicles in household, the demographic groups most similar to Poles are Cajun (91.7%, a difference of 0.0%), Immigrants from Iran (91.7%, a difference of 0.010%), Lithuanian (91.7%, a difference of 0.020%), Palestinian (91.7%, a difference of 0.040%), and Immigrants from Lebanon (91.6%, a difference of 0.050%).
| Demographics | Rating | Rank | 1 or more Vehicles in Household |
| Croatians | 99.8 /100 | #64 | Exceptional 91.9% |
| Immigrants | Laos | 99.8 /100 | #65 | Exceptional 91.8% |
| Canadians | 99.8 /100 | #66 | Exceptional 91.8% |
| Spaniards | 99.8 /100 | #67 | Exceptional 91.8% |
| Immigrants | Scotland | 99.7 /100 | #68 | Exceptional 91.8% |
| Palestinians | 99.7 /100 | #69 | Exceptional 91.7% |
| Lithuanians | 99.7 /100 | #70 | Exceptional 91.7% |
| Poles | 99.7 /100 | #71 | Exceptional 91.7% |
| Cajuns | 99.7 /100 | #72 | Exceptional 91.7% |
| Immigrants | Iran | 99.7 /100 | #73 | Exceptional 91.7% |
| Immigrants | Lebanon | 99.6 /100 | #74 | Exceptional 91.6% |
| Portuguese | 99.5 /100 | #75 | Exceptional 91.6% |
| Cubans | 99.5 /100 | #76 | Exceptional 91.5% |
| Immigrants | Philippines | 99.4 /100 | #77 | Exceptional 91.5% |
| Iranians | 99.4 /100 | #78 | Exceptional 91.5% |