Cambodian vs Immigrants from Guyana No Vehicles in Household
COMPARE
Cambodian
Immigrants from Guyana
No Vehicles in Household
No Vehicles in Household Comparison
Cambodians
Immigrants from Guyana
10.9%
NO VEHICLES IN HOUSEHOLD
19.6/ 100
METRIC RATING
200th/ 347
METRIC RANK
29.5%
NO VEHICLES IN HOUSEHOLD
0.0/ 100
METRIC RATING
341st/ 347
METRIC RANK
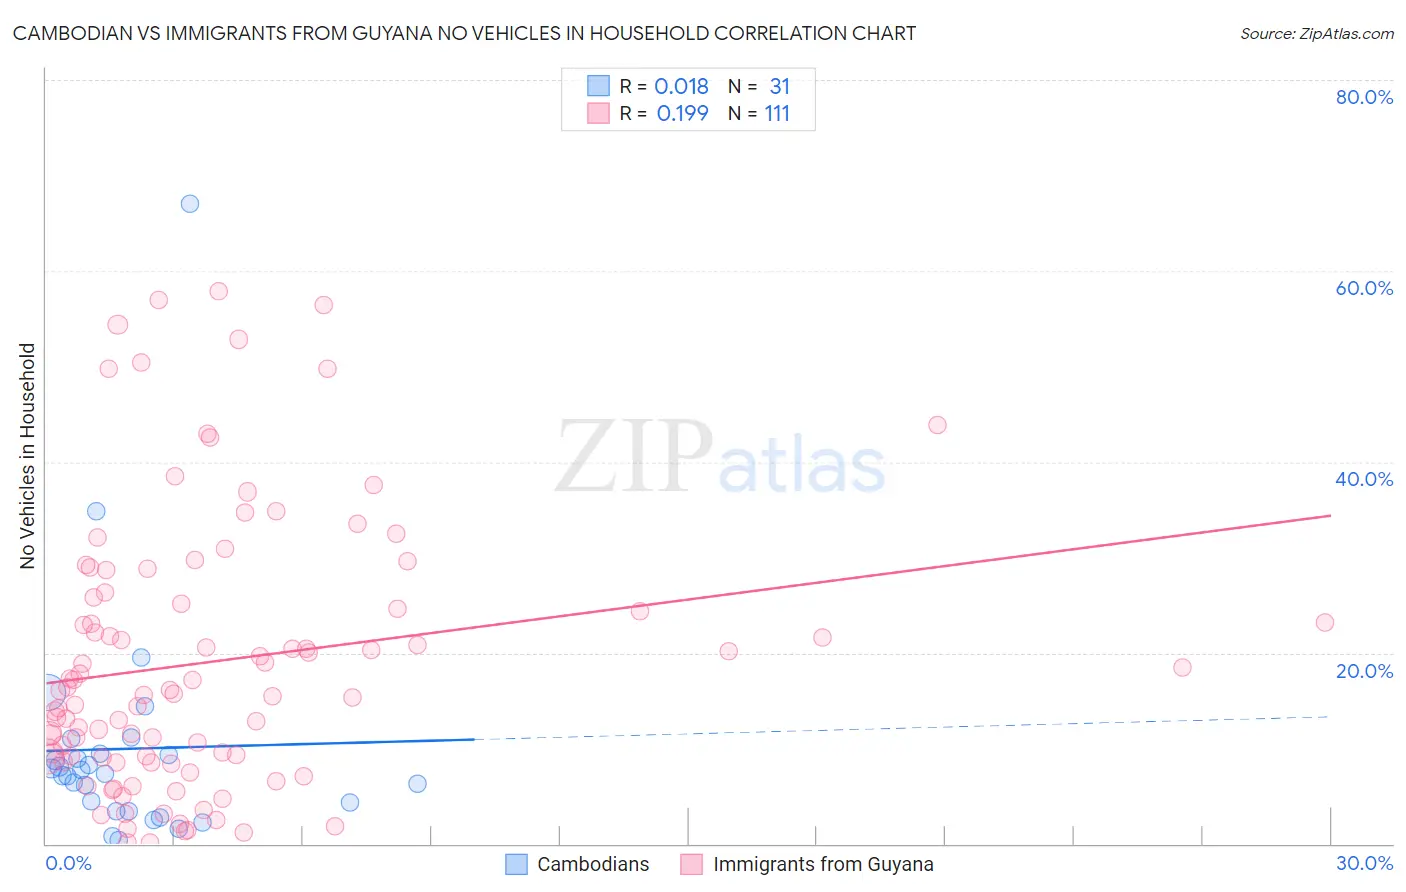
Cambodian vs Immigrants from Guyana No Vehicles in Household Correlation Chart
The statistical analysis conducted on geographies consisting of 102,425,487 people shows no correlation between the proportion of Cambodians and percentage of households with no vehicle available in the United States with a correlation coefficient (R) of 0.018 and weighted average of 10.9%. Similarly, the statistical analysis conducted on geographies consisting of 183,360,608 people shows a poor positive correlation between the proportion of Immigrants from Guyana and percentage of households with no vehicle available in the United States with a correlation coefficient (R) of 0.199 and weighted average of 29.5%, a difference of 170.6%.
No Vehicles in Household Correlation Summary
| Measurement | Cambodian | Immigrants from Guyana |
| Minimum | 0.45% | 0.084% |
| Maximum | 67.0% | 57.8% |
| Range | 66.6% | 57.7% |
| Mean | 9.9% | 19.1% |
| Median | 7.4% | 16.0% |
| Interquartile 25% (IQ1) | 3.4% | 9.0% |
| Interquartile 75% (IQ3) | 9.4% | 25.8% |
| Interquartile Range (IQR) | 6.0% | 16.7% |
| Standard Deviation (Sample) | 12.5% | 14.1% |
| Standard Deviation (Population) | 12.3% | 14.1% |
Similar Demographics by No Vehicles in Household
Demographics Similar to Cambodians by No Vehicles in Household
In terms of no vehicles in household, the demographic groups most similar to Cambodians are Immigrants from Western Europe (10.9%, a difference of 0.11%), Immigrants from Asia (10.9%, a difference of 0.33%), Romanian (10.9%, a difference of 0.38%), Iroquois (10.9%, a difference of 0.45%), and Immigrants from Sweden (10.8%, a difference of 0.64%).
| Demographics | Rating | Rank | No Vehicles in Household |
| Ukrainians | 28.0 /100 | #193 | Fair 10.7% |
| Pueblo | 27.0 /100 | #194 | Fair 10.8% |
| Immigrants | Brazil | 26.3 /100 | #195 | Fair 10.8% |
| Central Americans | 24.3 /100 | #196 | Fair 10.8% |
| Shoshone | 24.1 /100 | #197 | Fair 10.8% |
| Immigrants | Sweden | 22.9 /100 | #198 | Fair 10.8% |
| Immigrants | Asia | 21.3 /100 | #199 | Fair 10.9% |
| Cambodians | 19.6 /100 | #200 | Poor 10.9% |
| Immigrants | Western Europe | 19.1 /100 | #201 | Poor 10.9% |
| Romanians | 17.9 /100 | #202 | Poor 10.9% |
| Iroquois | 17.6 /100 | #203 | Poor 10.9% |
| Guatemalans | 16.1 /100 | #204 | Poor 11.0% |
| Immigrants | Chile | 15.9 /100 | #205 | Poor 11.0% |
| Somalis | 15.9 /100 | #206 | Poor 11.0% |
| Sierra Leoneans | 15.7 /100 | #207 | Poor 11.0% |
Demographics Similar to Immigrants from Guyana by No Vehicles in Household
In terms of no vehicles in household, the demographic groups most similar to Immigrants from Guyana are Immigrants from Barbados (29.5%, a difference of 0.050%), Dominican (29.4%, a difference of 0.28%), Guyanese (29.3%, a difference of 0.64%), British West Indian (29.7%, a difference of 0.85%), and Inupiat (29.9%, a difference of 1.3%).
| Demographics | Rating | Rank | No Vehicles in Household |
| Immigrants | Trinidad and Tobago | 0.0 /100 | #333 | Tragic 24.6% |
| Immigrants | Bangladesh | 0.0 /100 | #334 | Tragic 25.8% |
| Barbadians | 0.0 /100 | #335 | Tragic 26.1% |
| Vietnamese | 0.0 /100 | #336 | Tragic 26.2% |
| Immigrants | Uzbekistan | 0.0 /100 | #337 | Tragic 26.7% |
| Guyanese | 0.0 /100 | #338 | Tragic 29.3% |
| Dominicans | 0.0 /100 | #339 | Tragic 29.4% |
| Immigrants | Barbados | 0.0 /100 | #340 | Tragic 29.5% |
| Immigrants | Guyana | 0.0 /100 | #341 | Tragic 29.5% |
| British West Indians | 0.0 /100 | #342 | Tragic 29.7% |
| Inupiat | 0.0 /100 | #343 | Tragic 29.9% |
| Immigrants | Dominican Republic | 0.0 /100 | #344 | Tragic 31.4% |
| Immigrants | St. Vincent and the Grenadines | 0.0 /100 | #345 | Tragic 35.4% |
| Immigrants | Grenada | 0.0 /100 | #346 | Tragic 37.5% |
| Yup'ik | 0.0 /100 | #347 | Tragic 45.9% |