Cambodian vs Hungarian No Vehicles in Household
COMPARE
Cambodian
Hungarian
No Vehicles in Household
No Vehicles in Household Comparison
Cambodians
Hungarians
10.9%
NO VEHICLES IN HOUSEHOLD
19.6/ 100
METRIC RATING
200th/ 347
METRIC RANK
9.9%
NO VEHICLES IN HOUSEHOLD
80.0/ 100
METRIC RATING
146th/ 347
METRIC RANK
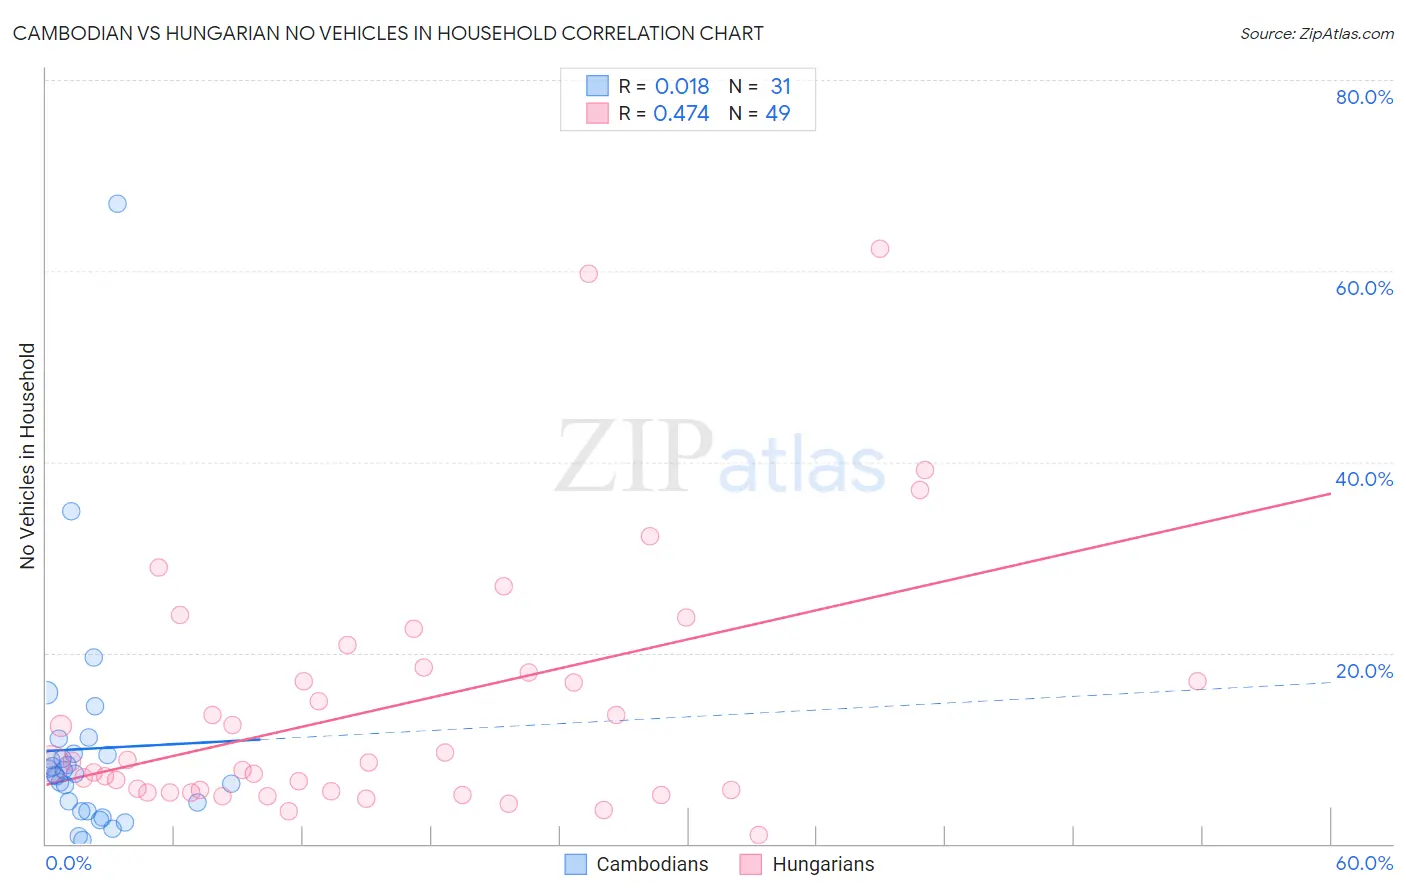
Cambodian vs Hungarian No Vehicles in Household Correlation Chart
The statistical analysis conducted on geographies consisting of 102,425,487 people shows no correlation between the proportion of Cambodians and percentage of households with no vehicle available in the United States with a correlation coefficient (R) of 0.018 and weighted average of 10.9%. Similarly, the statistical analysis conducted on geographies consisting of 483,786,573 people shows a moderate positive correlation between the proportion of Hungarians and percentage of households with no vehicle available in the United States with a correlation coefficient (R) of 0.474 and weighted average of 9.9%, a difference of 9.9%.
No Vehicles in Household Correlation Summary
| Measurement | Cambodian | Hungarian |
| Minimum | 0.45% | 0.88% |
| Maximum | 67.0% | 62.3% |
| Range | 66.6% | 61.5% |
| Mean | 9.9% | 14.3% |
| Median | 7.4% | 8.5% |
| Interquartile 25% (IQ1) | 3.4% | 5.5% |
| Interquartile 75% (IQ3) | 9.4% | 18.2% |
| Interquartile Range (IQR) | 6.0% | 12.8% |
| Standard Deviation (Sample) | 12.5% | 13.4% |
| Standard Deviation (Population) | 12.3% | 13.2% |
Similar Demographics by No Vehicles in Household
Demographics Similar to Cambodians by No Vehicles in Household
In terms of no vehicles in household, the demographic groups most similar to Cambodians are Immigrants from Western Europe (10.9%, a difference of 0.11%), Immigrants from Asia (10.9%, a difference of 0.33%), Romanian (10.9%, a difference of 0.38%), Iroquois (10.9%, a difference of 0.45%), and Immigrants from Sweden (10.8%, a difference of 0.64%).
| Demographics | Rating | Rank | No Vehicles in Household |
| Ukrainians | 28.0 /100 | #193 | Fair 10.7% |
| Pueblo | 27.0 /100 | #194 | Fair 10.8% |
| Immigrants | Brazil | 26.3 /100 | #195 | Fair 10.8% |
| Central Americans | 24.3 /100 | #196 | Fair 10.8% |
| Shoshone | 24.1 /100 | #197 | Fair 10.8% |
| Immigrants | Sweden | 22.9 /100 | #198 | Fair 10.8% |
| Immigrants | Asia | 21.3 /100 | #199 | Fair 10.9% |
| Cambodians | 19.6 /100 | #200 | Poor 10.9% |
| Immigrants | Western Europe | 19.1 /100 | #201 | Poor 10.9% |
| Romanians | 17.9 /100 | #202 | Poor 10.9% |
| Iroquois | 17.6 /100 | #203 | Poor 10.9% |
| Guatemalans | 16.1 /100 | #204 | Poor 11.0% |
| Immigrants | Chile | 15.9 /100 | #205 | Poor 11.0% |
| Somalis | 15.9 /100 | #206 | Poor 11.0% |
| Sierra Leoneans | 15.7 /100 | #207 | Poor 11.0% |
Demographics Similar to Hungarians by No Vehicles in Household
In terms of no vehicles in household, the demographic groups most similar to Hungarians are Immigrants from Nicaragua (9.9%, a difference of 0.060%), Immigrants from Bosnia and Herzegovina (9.9%, a difference of 0.20%), Bahamian (9.9%, a difference of 0.23%), Chilean (9.9%, a difference of 0.26%), and Immigrants from Bahamas (9.9%, a difference of 0.26%).
| Demographics | Rating | Rank | No Vehicles in Household |
| Marshallese | 84.0 /100 | #139 | Excellent 9.8% |
| Immigrants | Lithuania | 84.0 /100 | #140 | Excellent 9.8% |
| Sudanese | 83.1 /100 | #141 | Excellent 9.8% |
| Immigrants | Zimbabwe | 82.6 /100 | #142 | Excellent 9.9% |
| Chileans | 81.2 /100 | #143 | Excellent 9.9% |
| Immigrants | Bahamas | 81.2 /100 | #144 | Excellent 9.9% |
| Bahamians | 81.0 /100 | #145 | Excellent 9.9% |
| Hungarians | 80.0 /100 | #146 | Excellent 9.9% |
| Immigrants | Nicaragua | 79.8 /100 | #147 | Good 9.9% |
| Immigrants | Bosnia and Herzegovina | 79.1 /100 | #148 | Good 9.9% |
| Immigrants | Uganda | 76.1 /100 | #149 | Good 10.0% |
| Colombians | 73.9 /100 | #150 | Good 10.0% |
| Immigrants | Eastern Africa | 73.8 /100 | #151 | Good 10.0% |
| Immigrants | Congo | 73.0 /100 | #152 | Good 10.1% |
| Tlingit-Haida | 72.5 /100 | #153 | Good 10.1% |