Cambodian vs Immigrants from Thailand No Vehicles in Household
COMPARE
Cambodian
Immigrants from Thailand
No Vehicles in Household
No Vehicles in Household Comparison
Cambodians
Immigrants from Thailand
10.9%
NO VEHICLES IN HOUSEHOLD
19.6/ 100
METRIC RATING
200th/ 347
METRIC RANK
9.5%
NO VEHICLES IN HOUSEHOLD
92.6/ 100
METRIC RATING
120th/ 347
METRIC RANK
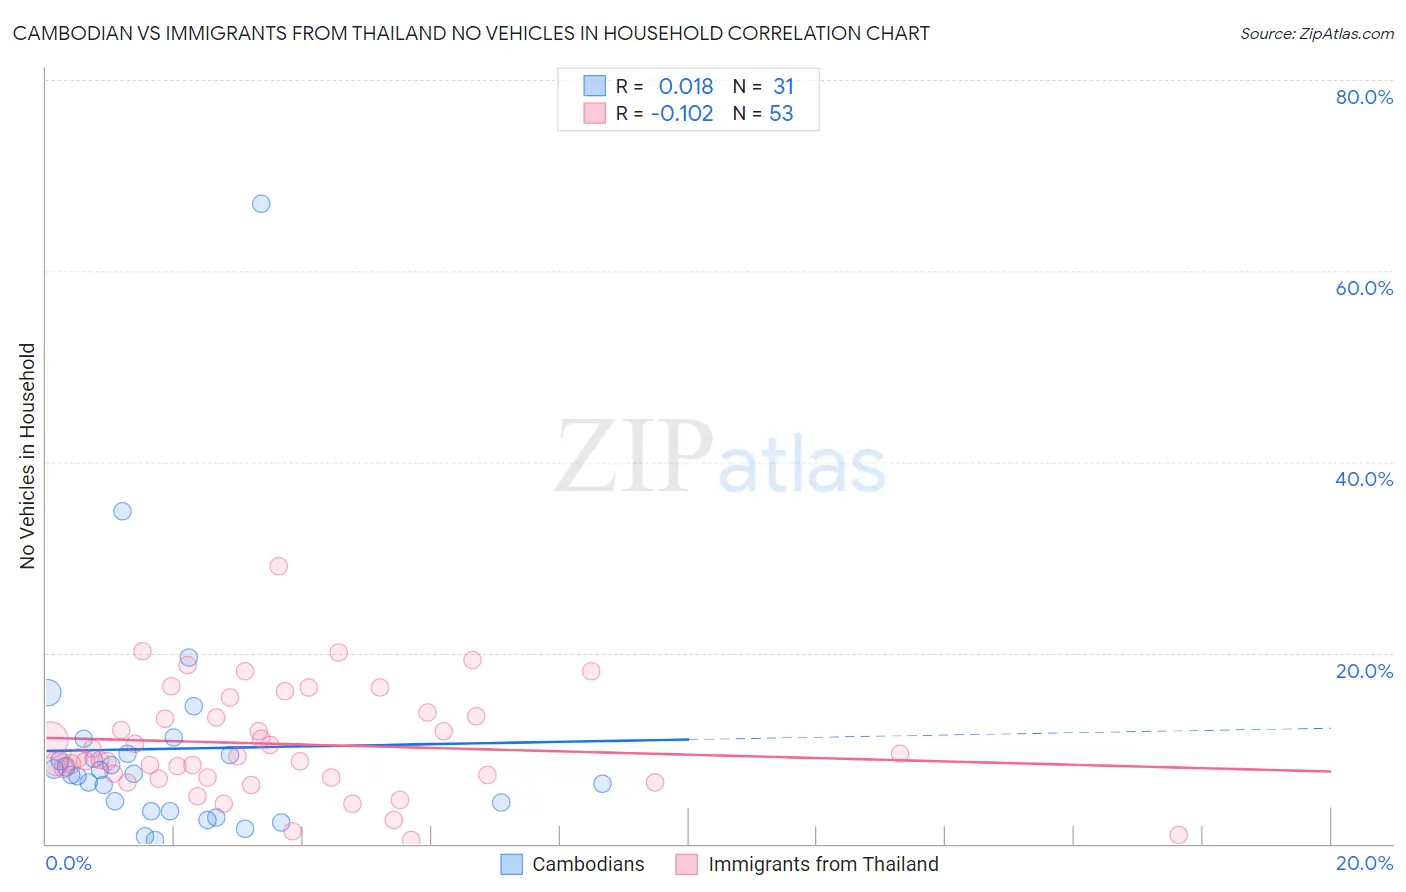
Cambodian vs Immigrants from Thailand No Vehicles in Household Correlation Chart
The statistical analysis conducted on geographies consisting of 102,425,487 people shows no correlation between the proportion of Cambodians and percentage of households with no vehicle available in the United States with a correlation coefficient (R) of 0.018 and weighted average of 10.9%. Similarly, the statistical analysis conducted on geographies consisting of 316,566,006 people shows a poor negative correlation between the proportion of Immigrants from Thailand and percentage of households with no vehicle available in the United States with a correlation coefficient (R) of -0.102 and weighted average of 9.5%, a difference of 14.6%.
No Vehicles in Household Correlation Summary
| Measurement | Cambodian | Immigrants from Thailand |
| Minimum | 0.45% | 0.37% |
| Maximum | 67.0% | 29.0% |
| Range | 66.6% | 28.6% |
| Mean | 9.9% | 10.5% |
| Median | 7.4% | 9.0% |
| Interquartile 25% (IQ1) | 3.4% | 6.9% |
| Interquartile 75% (IQ3) | 9.4% | 13.5% |
| Interquartile Range (IQR) | 6.0% | 6.6% |
| Standard Deviation (Sample) | 12.5% | 5.6% |
| Standard Deviation (Population) | 12.3% | 5.5% |
Similar Demographics by No Vehicles in Household
Demographics Similar to Cambodians by No Vehicles in Household
In terms of no vehicles in household, the demographic groups most similar to Cambodians are Immigrants from Western Europe (10.9%, a difference of 0.11%), Immigrants from Asia (10.9%, a difference of 0.33%), Romanian (10.9%, a difference of 0.38%), Iroquois (10.9%, a difference of 0.45%), and Immigrants from Sweden (10.8%, a difference of 0.64%).
| Demographics | Rating | Rank | No Vehicles in Household |
| Ukrainians | 28.0 /100 | #193 | Fair 10.7% |
| Pueblo | 27.0 /100 | #194 | Fair 10.8% |
| Immigrants | Brazil | 26.3 /100 | #195 | Fair 10.8% |
| Central Americans | 24.3 /100 | #196 | Fair 10.8% |
| Shoshone | 24.1 /100 | #197 | Fair 10.8% |
| Immigrants | Sweden | 22.9 /100 | #198 | Fair 10.8% |
| Immigrants | Asia | 21.3 /100 | #199 | Fair 10.9% |
| Cambodians | 19.6 /100 | #200 | Poor 10.9% |
| Immigrants | Western Europe | 19.1 /100 | #201 | Poor 10.9% |
| Romanians | 17.9 /100 | #202 | Poor 10.9% |
| Iroquois | 17.6 /100 | #203 | Poor 10.9% |
| Guatemalans | 16.1 /100 | #204 | Poor 11.0% |
| Immigrants | Chile | 15.9 /100 | #205 | Poor 11.0% |
| Somalis | 15.9 /100 | #206 | Poor 11.0% |
| Sierra Leoneans | 15.7 /100 | #207 | Poor 11.0% |
Demographics Similar to Immigrants from Thailand by No Vehicles in Household
In terms of no vehicles in household, the demographic groups most similar to Immigrants from Thailand are Fijian (9.5%, a difference of 0.060%), Puget Sound Salish (9.5%, a difference of 0.10%), Costa Rican (9.5%, a difference of 0.15%), Greek (9.5%, a difference of 0.17%), and Blackfeet (9.6%, a difference of 0.61%).
| Demographics | Rating | Rank | No Vehicles in Household |
| Immigrants | Netherlands | 94.8 /100 | #113 | Exceptional 9.4% |
| Serbians | 94.3 /100 | #114 | Exceptional 9.4% |
| Navajo | 94.2 /100 | #115 | Exceptional 9.4% |
| Japanese | 94.1 /100 | #116 | Exceptional 9.4% |
| Chippewa | 93.8 /100 | #117 | Exceptional 9.4% |
| Greeks | 92.9 /100 | #118 | Exceptional 9.5% |
| Fijians | 92.7 /100 | #119 | Exceptional 9.5% |
| Immigrants | Thailand | 92.6 /100 | #120 | Exceptional 9.5% |
| Puget Sound Salish | 92.4 /100 | #121 | Exceptional 9.5% |
| Costa Ricans | 92.3 /100 | #122 | Exceptional 9.5% |
| Blackfeet | 91.4 /100 | #123 | Exceptional 9.6% |
| Immigrants | Korea | 90.9 /100 | #124 | Exceptional 9.6% |
| Immigrants | Cameroon | 90.6 /100 | #125 | Exceptional 9.6% |
| Icelanders | 90.2 /100 | #126 | Exceptional 9.6% |
| Immigrants | Kenya | 89.7 /100 | #127 | Excellent 9.6% |