British West Indian vs Paiute Unemployment Among Youth under 25 years
COMPARE
British West Indian
Paiute
Unemployment Among Youth under 25 years
Unemployment Among Youth under 25 years Comparison
British West Indians
Paiute
15.5%
UNEMPLOYMENT AMONG YOUTH UNDER 25 YEARS
0.0/ 100
METRIC RATING
327th/ 347
METRIC RANK
17.6%
UNEMPLOYMENT AMONG YOUTH UNDER 25 YEARS
0.0/ 100
METRIC RATING
341st/ 347
METRIC RANK
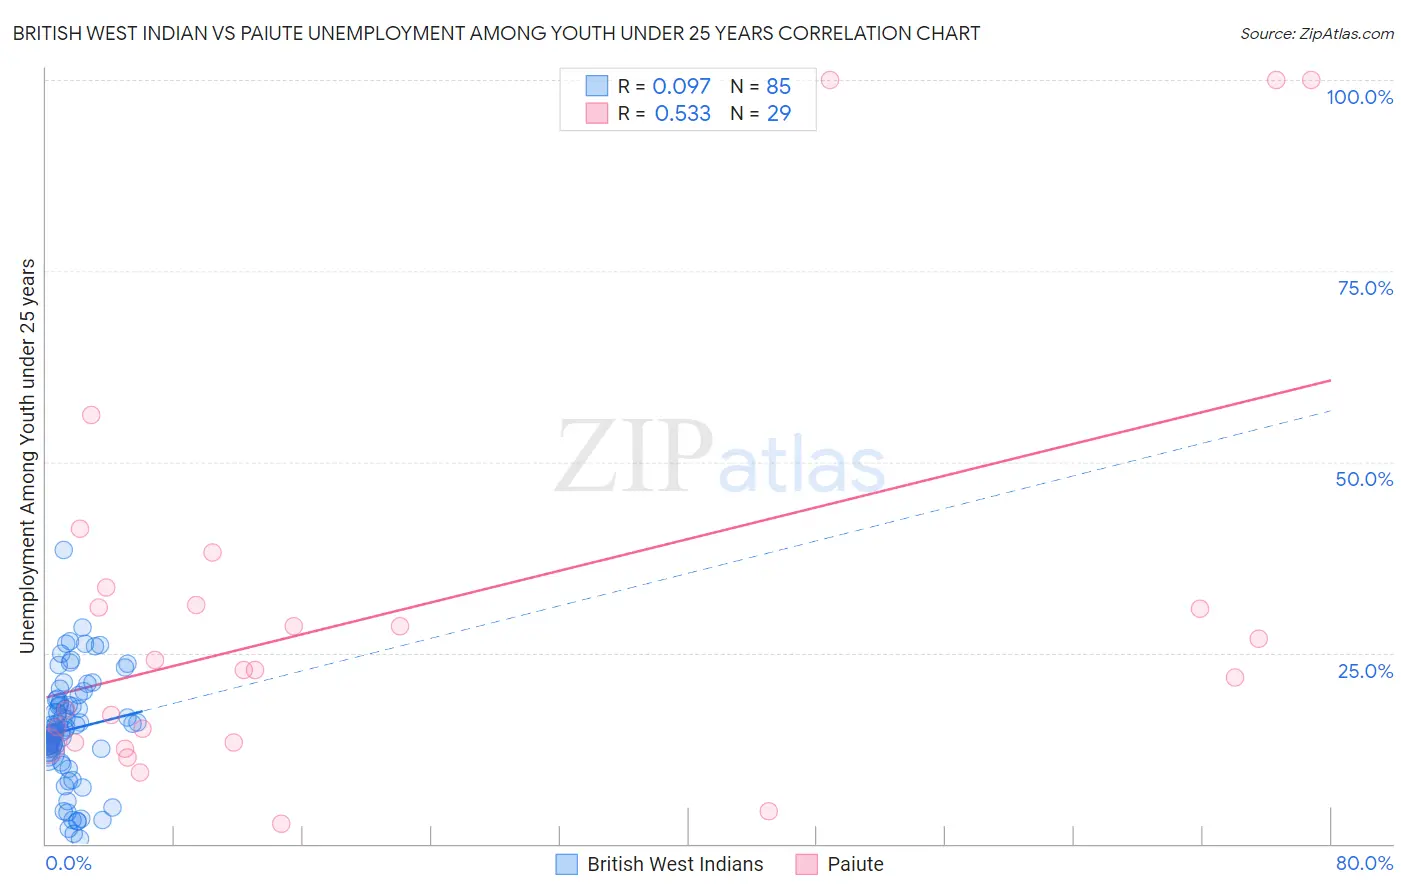
British West Indian vs Paiute Unemployment Among Youth under 25 years Correlation Chart
The statistical analysis conducted on geographies consisting of 152,199,351 people shows a slight positive correlation between the proportion of British West Indians and unemployment rate among youth under the age of 25 in the United States with a correlation coefficient (R) of 0.097 and weighted average of 15.5%. Similarly, the statistical analysis conducted on geographies consisting of 58,170,171 people shows a substantial positive correlation between the proportion of Paiute and unemployment rate among youth under the age of 25 in the United States with a correlation coefficient (R) of 0.533 and weighted average of 17.6%, a difference of 13.0%.
Unemployment Among Youth under 25 years Correlation Summary
| Measurement | British West Indian | Paiute |
| Minimum | 0.70% | 2.7% |
| Maximum | 38.4% | 100.0% |
| Range | 37.7% | 97.3% |
| Mean | 14.9% | 30.4% |
| Median | 14.9% | 22.8% |
| Interquartile 25% (IQ1) | 12.0% | 13.3% |
| Interquartile 75% (IQ3) | 18.7% | 32.4% |
| Interquartile Range (IQR) | 6.7% | 19.1% |
| Standard Deviation (Sample) | 7.1% | 26.7% |
| Standard Deviation (Population) | 7.0% | 26.2% |
Demographics Similar to British West Indians and Paiute by Unemployment Among Youth under 25 years
In terms of unemployment among youth under 25 years, the demographic groups most similar to British West Indians are Immigrants from Dominican Republic (15.6%, a difference of 0.11%), Immigrants from Yemen (15.6%, a difference of 0.24%), Yakama (15.6%, a difference of 0.28%), Dominican (15.7%, a difference of 1.1%), and Immigrants from Grenada (15.8%, a difference of 1.8%). Similarly, the demographic groups most similar to Paiute are Colville (16.8%, a difference of 4.8%), Puerto Rican (18.4%, a difference of 4.8%), Navajo (18.6%, a difference of 6.0%), Tsimshian (16.5%, a difference of 6.5%), and Yuman (16.3%, a difference of 7.6%).
| Demographics | Rating | Rank | Unemployment Among Youth under 25 years |
| Immigrants | Jamaica | 0.0 /100 | #324 | Tragic 14.8% |
| Alaska Natives | 0.0 /100 | #325 | Tragic 14.9% |
| Immigrants | Barbados | 0.0 /100 | #326 | Tragic 15.2% |
| British West Indians | 0.0 /100 | #327 | Tragic 15.5% |
| Immigrants | Dominican Republic | 0.0 /100 | #328 | Tragic 15.6% |
| Immigrants | Yemen | 0.0 /100 | #329 | Tragic 15.6% |
| Yakama | 0.0 /100 | #330 | Tragic 15.6% |
| Dominicans | 0.0 /100 | #331 | Tragic 15.7% |
| Immigrants | Grenada | 0.0 /100 | #332 | Tragic 15.8% |
| Guyanese | 0.0 /100 | #333 | Tragic 15.9% |
| Immigrants | Guyana | 0.0 /100 | #334 | Tragic 15.9% |
| Immigrants | St. Vincent and the Grenadines | 0.0 /100 | #335 | Tragic 16.1% |
| Pima | 0.0 /100 | #336 | Tragic 16.2% |
| Arapaho | 0.0 /100 | #337 | Tragic 16.3% |
| Yuman | 0.0 /100 | #338 | Tragic 16.3% |
| Tsimshian | 0.0 /100 | #339 | Tragic 16.5% |
| Colville | 0.0 /100 | #340 | Tragic 16.8% |
| Paiute | 0.0 /100 | #341 | Tragic 17.6% |
| Puerto Ricans | 0.0 /100 | #342 | Tragic 18.4% |
| Navajo | 0.0 /100 | #343 | Tragic 18.6% |
| Crow | 0.0 /100 | #344 | Tragic 20.1% |