Brazilian vs Immigrants from Kenya 2 or more Vehicles in Household
COMPARE
Brazilian
Immigrants from Kenya
2 or more Vehicles in Household
2 or more Vehicles in Household Comparison
Brazilians
Immigrants from Kenya
53.8%
2 OR MORE VEHICLES IN HOUSEHOLD
5.3/ 100
METRIC RATING
224th/ 347
METRIC RANK
55.1%
2 OR MORE VEHICLES IN HOUSEHOLD
40.4/ 100
METRIC RATING
180th/ 347
METRIC RANK
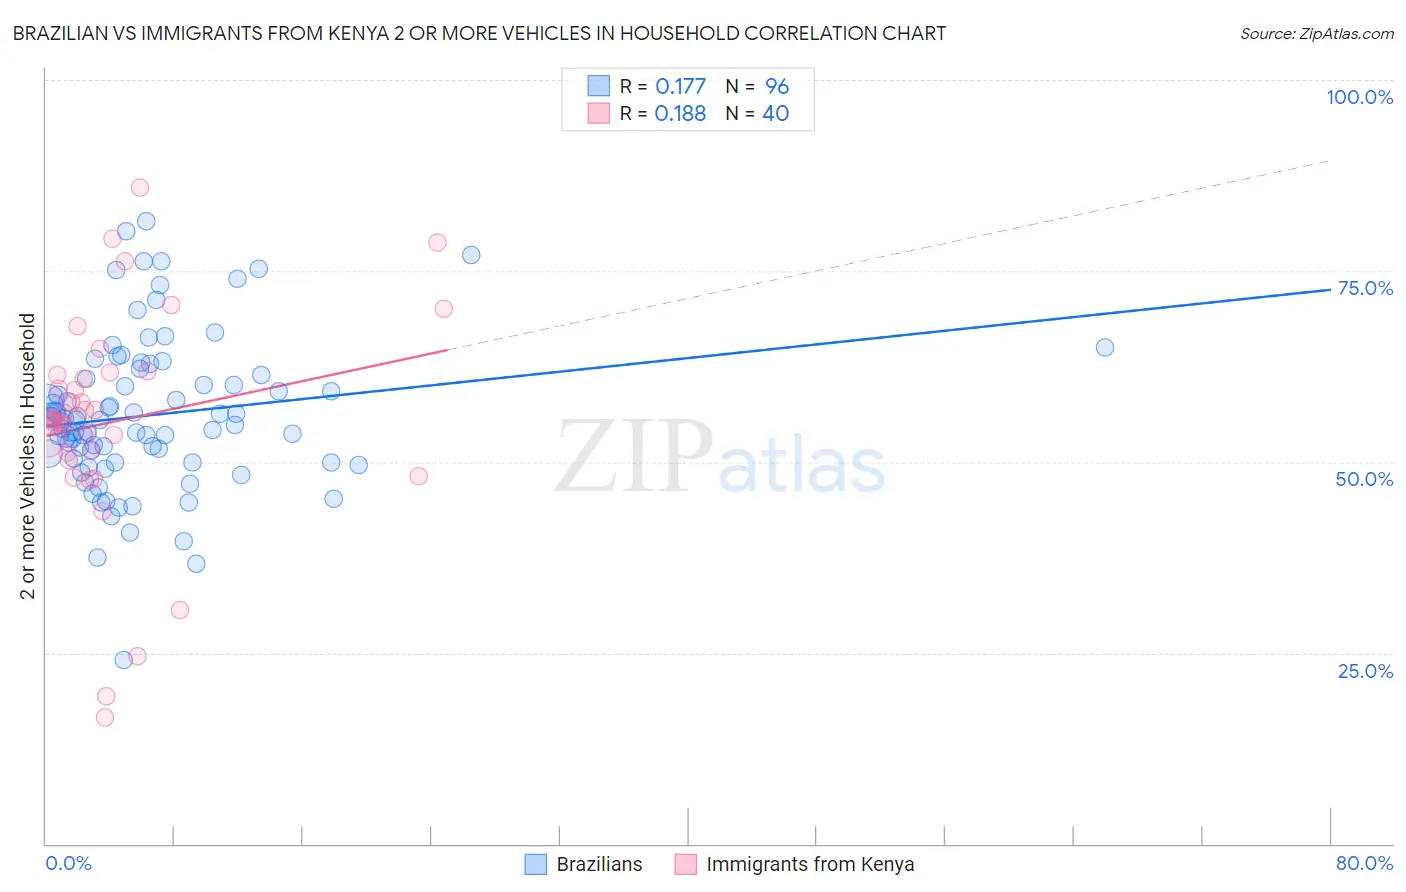
Brazilian vs Immigrants from Kenya 2 or more Vehicles in Household Correlation Chart
The statistical analysis conducted on geographies consisting of 323,674,427 people shows a poor positive correlation between the proportion of Brazilians and percentage of households with 2 or more vehicles available in the United States with a correlation coefficient (R) of 0.177 and weighted average of 53.8%. Similarly, the statistical analysis conducted on geographies consisting of 218,001,481 people shows a poor positive correlation between the proportion of Immigrants from Kenya and percentage of households with 2 or more vehicles available in the United States with a correlation coefficient (R) of 0.188 and weighted average of 55.1%, a difference of 2.6%.
2 or more Vehicles in Household Correlation Summary
| Measurement | Brazilian | Immigrants from Kenya |
| Minimum | 24.1% | 16.4% |
| Maximum | 81.5% | 85.9% |
| Range | 57.4% | 69.4% |
| Mean | 56.1% | 55.3% |
| Median | 55.4% | 55.6% |
| Interquartile 25% (IQ1) | 50.2% | 50.7% |
| Interquartile 75% (IQ3) | 61.1% | 61.6% |
| Interquartile Range (IQR) | 10.9% | 10.9% |
| Standard Deviation (Sample) | 10.0% | 14.5% |
| Standard Deviation (Population) | 9.9% | 14.3% |
Similar Demographics by 2 or more Vehicles in Household
Demographics Similar to Brazilians by 2 or more Vehicles in Household
In terms of 2 or more vehicles in household, the demographic groups most similar to Brazilians are Immigrants from Egypt (53.8%, a difference of 0.010%), Immigrants from Eastern Africa (53.7%, a difference of 0.030%), Immigrants from Bosnia and Herzegovina (53.8%, a difference of 0.040%), Kiowa (53.9%, a difference of 0.17%), and Immigrants from Singapore (53.9%, a difference of 0.19%).
| Demographics | Rating | Rank | 2 or more Vehicles in Household |
| Immigrants | Burma/Myanmar | 7.1 /100 | #217 | Tragic 53.9% |
| Immigrants | Argentina | 6.8 /100 | #218 | Tragic 53.9% |
| South American Indians | 6.5 /100 | #219 | Tragic 53.9% |
| Taiwanese | 6.3 /100 | #220 | Tragic 53.9% |
| Immigrants | Singapore | 6.3 /100 | #221 | Tragic 53.9% |
| Kiowa | 6.2 /100 | #222 | Tragic 53.9% |
| Immigrants | Bosnia and Herzegovina | 5.5 /100 | #223 | Tragic 53.8% |
| Brazilians | 5.3 /100 | #224 | Tragic 53.8% |
| Immigrants | Egypt | 5.2 /100 | #225 | Tragic 53.8% |
| Immigrants | Eastern Africa | 5.1 /100 | #226 | Tragic 53.7% |
| Sudanese | 4.1 /100 | #227 | Tragic 53.6% |
| Alaska Natives | 3.9 /100 | #228 | Tragic 53.6% |
| Immigrants | Turkey | 3.8 /100 | #229 | Tragic 53.6% |
| Immigrants | Nepal | 3.6 /100 | #230 | Tragic 53.5% |
| Panamanians | 3.4 /100 | #231 | Tragic 53.5% |
Demographics Similar to Immigrants from Kenya by 2 or more Vehicles in Household
In terms of 2 or more vehicles in household, the demographic groups most similar to Immigrants from Kenya are Immigrants from Micronesia (55.1%, a difference of 0.090%), Cree (55.1%, a difference of 0.090%), Alaskan Athabascan (55.2%, a difference of 0.11%), Immigrants from Cameroon (55.1%, a difference of 0.13%), and Apache (55.1%, a difference of 0.15%).
| Demographics | Rating | Rank | 2 or more Vehicles in Household |
| Immigrants | Western Europe | 51.4 /100 | #173 | Average 55.4% |
| Navajo | 50.0 /100 | #174 | Average 55.3% |
| Immigrants | Denmark | 49.4 /100 | #175 | Average 55.3% |
| Immigrants | Cuba | 47.0 /100 | #176 | Average 55.3% |
| Menominee | 46.2 /100 | #177 | Average 55.3% |
| Immigrants | Sweden | 45.3 /100 | #178 | Average 55.2% |
| Alaskan Athabascans | 42.9 /100 | #179 | Average 55.2% |
| Immigrants | Kenya | 40.4 /100 | #180 | Average 55.1% |
| Immigrants | Micronesia | 38.2 /100 | #181 | Fair 55.1% |
| Cree | 38.2 /100 | #182 | Fair 55.1% |
| Immigrants | Cameroon | 37.3 /100 | #183 | Fair 55.1% |
| Apache | 36.7 /100 | #184 | Fair 55.1% |
| Arabs | 35.9 /100 | #185 | Fair 55.0% |
| Peruvians | 33.7 /100 | #186 | Fair 55.0% |
| Immigrants | Uganda | 33.4 /100 | #187 | Fair 55.0% |