Cape Verdean vs Immigrants from Kenya 2 or more Vehicles in Household
COMPARE
Cape Verdean
Immigrants from Kenya
2 or more Vehicles in Household
2 or more Vehicles in Household Comparison
Cape Verdeans
Immigrants from Kenya
46.8%
2 OR MORE VEHICLES IN HOUSEHOLD
0.0/ 100
METRIC RATING
316th/ 347
METRIC RANK
55.1%
2 OR MORE VEHICLES IN HOUSEHOLD
40.4/ 100
METRIC RATING
180th/ 347
METRIC RANK
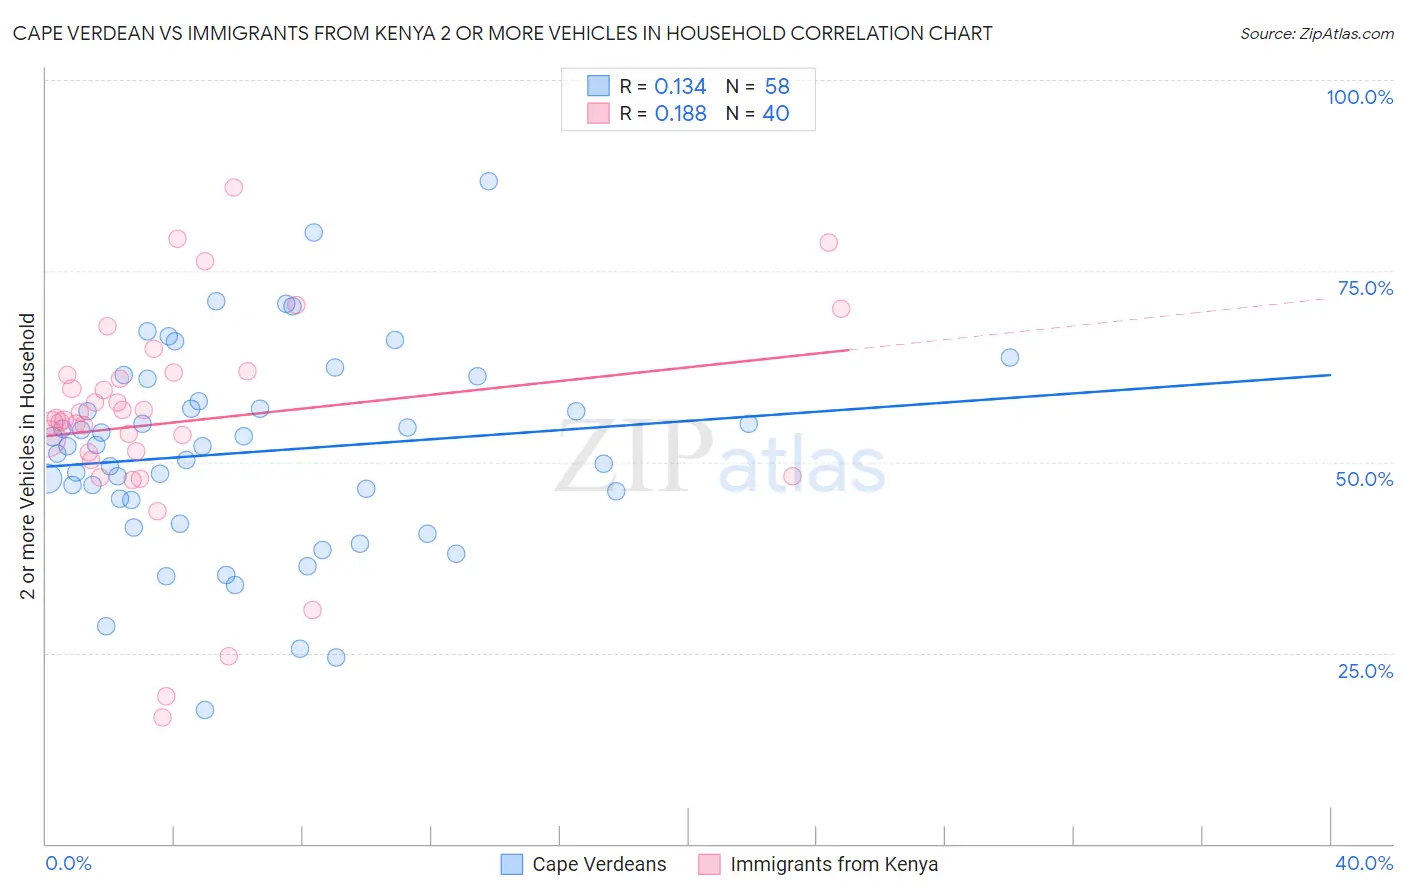
Cape Verdean vs Immigrants from Kenya 2 or more Vehicles in Household Correlation Chart
The statistical analysis conducted on geographies consisting of 107,560,246 people shows a poor positive correlation between the proportion of Cape Verdeans and percentage of households with 2 or more vehicles available in the United States with a correlation coefficient (R) of 0.134 and weighted average of 46.8%. Similarly, the statistical analysis conducted on geographies consisting of 218,001,481 people shows a poor positive correlation between the proportion of Immigrants from Kenya and percentage of households with 2 or more vehicles available in the United States with a correlation coefficient (R) of 0.188 and weighted average of 55.1%, a difference of 17.9%.
2 or more Vehicles in Household Correlation Summary
| Measurement | Cape Verdean | Immigrants from Kenya |
| Minimum | 17.5% | 16.4% |
| Maximum | 86.7% | 85.9% |
| Range | 69.1% | 69.4% |
| Mean | 51.3% | 55.3% |
| Median | 52.1% | 55.6% |
| Interquartile 25% (IQ1) | 45.1% | 50.7% |
| Interquartile 75% (IQ3) | 58.0% | 61.6% |
| Interquartile Range (IQR) | 12.9% | 10.9% |
| Standard Deviation (Sample) | 13.3% | 14.5% |
| Standard Deviation (Population) | 13.1% | 14.3% |
Similar Demographics by 2 or more Vehicles in Household
Demographics Similar to Cape Verdeans by 2 or more Vehicles in Household
In terms of 2 or more vehicles in household, the demographic groups most similar to Cape Verdeans are Immigrants from Haiti (46.5%, a difference of 0.53%), Puerto Rican (47.1%, a difference of 0.69%), Immigrants from Ghana (47.4%, a difference of 1.3%), U.S. Virgin Islander (47.5%, a difference of 1.5%), and Haitian (47.6%, a difference of 1.7%).
| Demographics | Rating | Rank | 2 or more Vehicles in Household |
| Moroccans | 0.0 /100 | #309 | Tragic 48.8% |
| Ghanaians | 0.0 /100 | #310 | Tragic 48.0% |
| Immigrants | Belarus | 0.0 /100 | #311 | Tragic 47.9% |
| Haitians | 0.0 /100 | #312 | Tragic 47.6% |
| U.S. Virgin Islanders | 0.0 /100 | #313 | Tragic 47.5% |
| Immigrants | Ghana | 0.0 /100 | #314 | Tragic 47.4% |
| Puerto Ricans | 0.0 /100 | #315 | Tragic 47.1% |
| Cape Verdeans | 0.0 /100 | #316 | Tragic 46.8% |
| Immigrants | Haiti | 0.0 /100 | #317 | Tragic 46.5% |
| Immigrants | Albania | 0.0 /100 | #318 | Tragic 46.0% |
| Jamaicans | 0.0 /100 | #319 | Tragic 45.8% |
| Soviet Union | 0.0 /100 | #320 | Tragic 45.7% |
| Immigrants | Jamaica | 0.0 /100 | #321 | Tragic 44.5% |
| Senegalese | 0.0 /100 | #322 | Tragic 44.2% |
| Immigrants | Caribbean | 0.0 /100 | #323 | Tragic 44.2% |
Demographics Similar to Immigrants from Kenya by 2 or more Vehicles in Household
In terms of 2 or more vehicles in household, the demographic groups most similar to Immigrants from Kenya are Immigrants from Micronesia (55.1%, a difference of 0.090%), Cree (55.1%, a difference of 0.090%), Alaskan Athabascan (55.2%, a difference of 0.11%), Immigrants from Cameroon (55.1%, a difference of 0.13%), and Apache (55.1%, a difference of 0.15%).
| Demographics | Rating | Rank | 2 or more Vehicles in Household |
| Immigrants | Western Europe | 51.4 /100 | #173 | Average 55.4% |
| Navajo | 50.0 /100 | #174 | Average 55.3% |
| Immigrants | Denmark | 49.4 /100 | #175 | Average 55.3% |
| Immigrants | Cuba | 47.0 /100 | #176 | Average 55.3% |
| Menominee | 46.2 /100 | #177 | Average 55.3% |
| Immigrants | Sweden | 45.3 /100 | #178 | Average 55.2% |
| Alaskan Athabascans | 42.9 /100 | #179 | Average 55.2% |
| Immigrants | Kenya | 40.4 /100 | #180 | Average 55.1% |
| Immigrants | Micronesia | 38.2 /100 | #181 | Fair 55.1% |
| Cree | 38.2 /100 | #182 | Fair 55.1% |
| Immigrants | Cameroon | 37.3 /100 | #183 | Fair 55.1% |
| Apache | 36.7 /100 | #184 | Fair 55.1% |
| Arabs | 35.9 /100 | #185 | Fair 55.0% |
| Peruvians | 33.7 /100 | #186 | Fair 55.0% |
| Immigrants | Uganda | 33.4 /100 | #187 | Fair 55.0% |