Blackfeet vs Immigrants from the Azores Child Poverty Under the Age of 16
COMPARE
Blackfeet
Immigrants from the Azores
Child Poverty Under the Age of 16
Child Poverty Under the Age of 16 Comparison
Blackfeet
Immigrants from the Azores
20.2%
CHILD POVERTY UNDER THE AGE OF 16
0.0/ 100
METRIC RATING
287th/ 347
METRIC RANK
17.5%
CHILD POVERTY UNDER THE AGE OF 16
6.2/ 100
METRIC RATING
213th/ 347
METRIC RANK
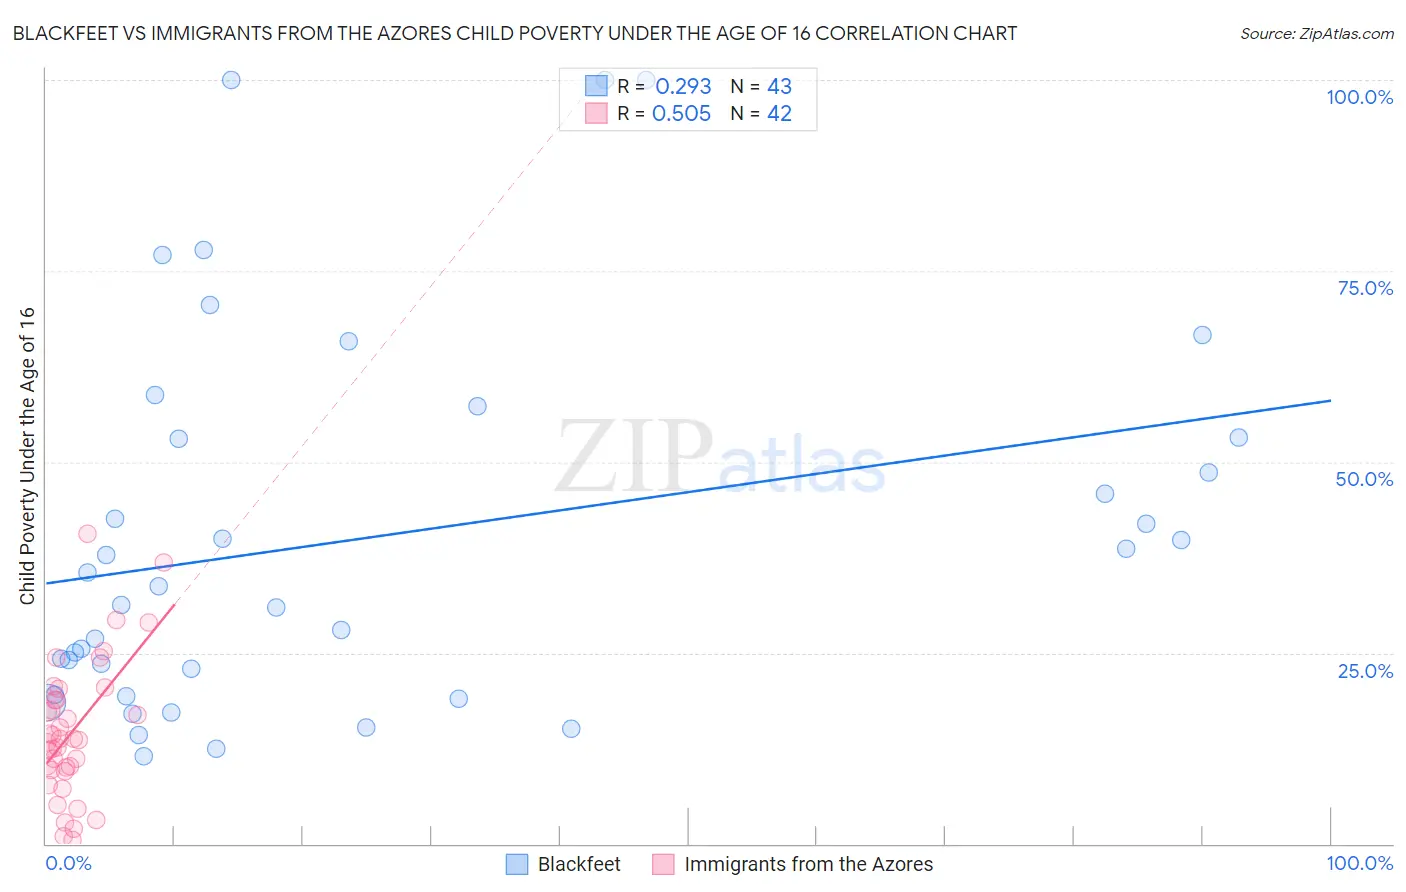
Blackfeet vs Immigrants from the Azores Child Poverty Under the Age of 16 Correlation Chart
The statistical analysis conducted on geographies consisting of 308,289,975 people shows a weak positive correlation between the proportion of Blackfeet and poverty level among children under the age of 16 in the United States with a correlation coefficient (R) of 0.293 and weighted average of 20.2%. Similarly, the statistical analysis conducted on geographies consisting of 46,043,926 people shows a substantial positive correlation between the proportion of Immigrants from the Azores and poverty level among children under the age of 16 in the United States with a correlation coefficient (R) of 0.505 and weighted average of 17.5%, a difference of 15.2%.
Child Poverty Under the Age of 16 Correlation Summary
| Measurement | Blackfeet | Immigrants from the Azores |
| Minimum | 11.5% | 0.48% |
| Maximum | 100.0% | 40.5% |
| Range | 88.5% | 40.0% |
| Mean | 40.1% | 14.7% |
| Median | 33.7% | 13.7% |
| Interquartile 25% (IQ1) | 19.5% | 9.7% |
| Interquartile 75% (IQ3) | 53.2% | 18.8% |
| Interquartile Range (IQR) | 33.7% | 9.1% |
| Standard Deviation (Sample) | 24.6% | 9.0% |
| Standard Deviation (Population) | 24.3% | 8.9% |
Similar Demographics by Child Poverty Under the Age of 16
Demographics Similar to Blackfeet by Child Poverty Under the Age of 16
In terms of child poverty under the age of 16, the demographic groups most similar to Blackfeet are Immigrants from West Indies (20.2%, a difference of 0.12%), Immigrants from St. Vincent and the Grenadines (20.1%, a difference of 0.26%), West Indian (20.1%, a difference of 0.32%), Immigrants from Zaire (20.1%, a difference of 0.46%), and Immigrants from Belize (20.3%, a difference of 0.59%).
| Demographics | Rating | Rank | Child Poverty Under the Age of 16 |
| Comanche | 0.0 /100 | #280 | Tragic 19.9% |
| Central Americans | 0.0 /100 | #281 | Tragic 20.0% |
| Barbadians | 0.0 /100 | #282 | Tragic 20.0% |
| Immigrants | Zaire | 0.0 /100 | #283 | Tragic 20.1% |
| West Indians | 0.0 /100 | #284 | Tragic 20.1% |
| Immigrants | St. Vincent and the Grenadines | 0.0 /100 | #285 | Tragic 20.1% |
| Immigrants | West Indies | 0.0 /100 | #286 | Tragic 20.2% |
| Blackfeet | 0.0 /100 | #287 | Tragic 20.2% |
| Immigrants | Belize | 0.0 /100 | #288 | Tragic 20.3% |
| Senegalese | 0.0 /100 | #289 | Tragic 20.4% |
| Yaqui | 0.0 /100 | #290 | Tragic 20.4% |
| Chippewa | 0.0 /100 | #291 | Tragic 20.5% |
| Immigrants | Latin America | 0.0 /100 | #292 | Tragic 20.5% |
| Immigrants | Senegal | 0.0 /100 | #293 | Tragic 20.6% |
| Haitians | 0.0 /100 | #294 | Tragic 20.7% |
Demographics Similar to Immigrants from the Azores by Child Poverty Under the Age of 16
In terms of child poverty under the age of 16, the demographic groups most similar to Immigrants from the Azores are Iraqi (17.5%, a difference of 0.12%), Malaysian (17.5%, a difference of 0.14%), Immigrants (17.5%, a difference of 0.17%), Immigrants from Thailand (17.5%, a difference of 0.19%), and Sierra Leonean (17.6%, a difference of 0.25%).
| Demographics | Rating | Rank | Child Poverty Under the Age of 16 |
| Alaska Natives | 11.8 /100 | #206 | Poor 17.2% |
| German Russians | 8.6 /100 | #207 | Tragic 17.4% |
| Pennsylvania Germans | 7.5 /100 | #208 | Tragic 17.4% |
| Panamanians | 6.9 /100 | #209 | Tragic 17.5% |
| Alaskan Athabascans | 6.9 /100 | #210 | Tragic 17.5% |
| Immigrants | Thailand | 6.6 /100 | #211 | Tragic 17.5% |
| Immigrants | Immigrants | 6.5 /100 | #212 | Tragic 17.5% |
| Immigrants | Azores | 6.2 /100 | #213 | Tragic 17.5% |
| Iraqis | 5.9 /100 | #214 | Tragic 17.5% |
| Malaysians | 5.9 /100 | #215 | Tragic 17.5% |
| Sierra Leoneans | 5.7 /100 | #216 | Tragic 17.6% |
| Immigrants | Eastern Africa | 5.3 /100 | #217 | Tragic 17.6% |
| Moroccans | 5.3 /100 | #218 | Tragic 17.6% |
| Japanese | 4.7 /100 | #219 | Tragic 17.7% |
| Immigrants | Panama | 4.1 /100 | #220 | Tragic 17.7% |