Blackfeet vs Immigrants from Belize No Vehicles in Household
COMPARE
Blackfeet
Immigrants from Belize
No Vehicles in Household
No Vehicles in Household Comparison
Blackfeet
Immigrants from Belize
9.6%
NO VEHICLES IN HOUSEHOLD
91.4/ 100
METRIC RATING
123rd/ 347
METRIC RANK
15.4%
NO VEHICLES IN HOUSEHOLD
0.0/ 100
METRIC RATING
306th/ 347
METRIC RANK
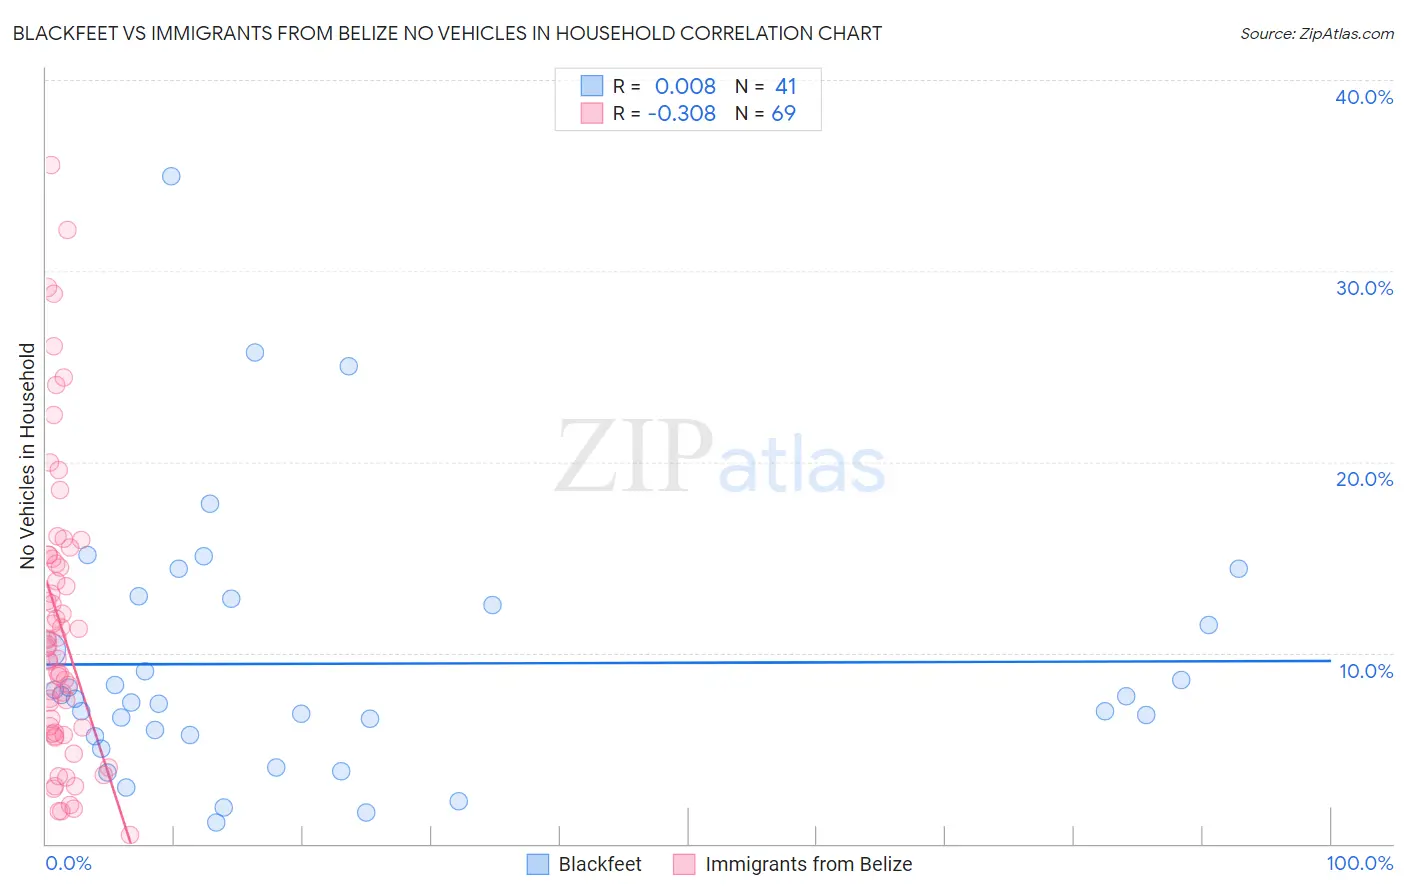
Blackfeet vs Immigrants from Belize No Vehicles in Household Correlation Chart
The statistical analysis conducted on geographies consisting of 309,020,066 people shows no correlation between the proportion of Blackfeet and percentage of households with no vehicle available in the United States with a correlation coefficient (R) of 0.008 and weighted average of 9.6%. Similarly, the statistical analysis conducted on geographies consisting of 130,253,773 people shows a mild negative correlation between the proportion of Immigrants from Belize and percentage of households with no vehicle available in the United States with a correlation coefficient (R) of -0.308 and weighted average of 15.4%, a difference of 60.5%.
No Vehicles in Household Correlation Summary
| Measurement | Blackfeet | Immigrants from Belize |
| Minimum | 1.1% | 0.48% |
| Maximum | 34.9% | 35.6% |
| Range | 33.8% | 35.1% |
| Mean | 9.4% | 11.4% |
| Median | 7.6% | 10.3% |
| Interquartile 25% (IQ1) | 5.7% | 5.8% |
| Interquartile 75% (IQ3) | 12.7% | 15.0% |
| Interquartile Range (IQR) | 7.0% | 9.3% |
| Standard Deviation (Sample) | 6.9% | 7.7% |
| Standard Deviation (Population) | 6.8% | 7.6% |
Similar Demographics by No Vehicles in Household
Demographics Similar to Blackfeet by No Vehicles in Household
In terms of no vehicles in household, the demographic groups most similar to Blackfeet are Immigrants from Korea (9.6%, a difference of 0.23%), Immigrants from Cameroon (9.6%, a difference of 0.36%), Costa Rican (9.5%, a difference of 0.46%), Puget Sound Salish (9.5%, a difference of 0.51%), and Icelander (9.6%, a difference of 0.52%).
| Demographics | Rating | Rank | No Vehicles in Household |
| Japanese | 94.1 /100 | #116 | Exceptional 9.4% |
| Chippewa | 93.8 /100 | #117 | Exceptional 9.4% |
| Greeks | 92.9 /100 | #118 | Exceptional 9.5% |
| Fijians | 92.7 /100 | #119 | Exceptional 9.5% |
| Immigrants | Thailand | 92.6 /100 | #120 | Exceptional 9.5% |
| Puget Sound Salish | 92.4 /100 | #121 | Exceptional 9.5% |
| Costa Ricans | 92.3 /100 | #122 | Exceptional 9.5% |
| Blackfeet | 91.4 /100 | #123 | Exceptional 9.6% |
| Immigrants | Korea | 90.9 /100 | #124 | Exceptional 9.6% |
| Immigrants | Cameroon | 90.6 /100 | #125 | Exceptional 9.6% |
| Icelanders | 90.2 /100 | #126 | Exceptional 9.6% |
| Immigrants | Kenya | 89.7 /100 | #127 | Excellent 9.6% |
| Immigrants | Syria | 89.5 /100 | #128 | Excellent 9.6% |
| Nicaraguans | 89.5 /100 | #129 | Excellent 9.7% |
| Burmese | 88.8 /100 | #130 | Excellent 9.7% |
Demographics Similar to Immigrants from Belize by No Vehicles in Household
In terms of no vehicles in household, the demographic groups most similar to Immigrants from Belize are Immigrants from Haiti (15.4%, a difference of 0.13%), U.S. Virgin Islander (15.4%, a difference of 0.17%), Puerto Rican (15.5%, a difference of 0.82%), Immigrants from China (15.2%, a difference of 1.3%), and Cape Verdean (15.6%, a difference of 1.4%).
| Demographics | Rating | Rank | No Vehicles in Household |
| Immigrants | Greece | 0.0 /100 | #299 | Tragic 14.7% |
| Yuman | 0.0 /100 | #300 | Tragic 14.9% |
| Immigrants | Ukraine | 0.0 /100 | #301 | Tragic 14.9% |
| Haitians | 0.0 /100 | #302 | Tragic 14.9% |
| Immigrants | Western Africa | 0.0 /100 | #303 | Tragic 15.0% |
| Immigrants | Russia | 0.0 /100 | #304 | Tragic 15.1% |
| Immigrants | China | 0.0 /100 | #305 | Tragic 15.2% |
| Immigrants | Belize | 0.0 /100 | #306 | Tragic 15.4% |
| Immigrants | Haiti | 0.0 /100 | #307 | Tragic 15.4% |
| U.S. Virgin Islanders | 0.0 /100 | #308 | Tragic 15.4% |
| Puerto Ricans | 0.0 /100 | #309 | Tragic 15.5% |
| Cape Verdeans | 0.0 /100 | #310 | Tragic 15.6% |
| Immigrants | Israel | 0.0 /100 | #311 | Tragic 15.6% |
| Alaskan Athabascans | 0.0 /100 | #312 | Tragic 15.6% |
| Tohono O'odham | 0.0 /100 | #313 | Tragic 15.6% |