Blackfeet vs Moroccan No Vehicles in Household
COMPARE
Blackfeet
Moroccan
No Vehicles in Household
No Vehicles in Household Comparison
Blackfeet
Moroccans
9.6%
NO VEHICLES IN HOUSEHOLD
91.4/ 100
METRIC RATING
123rd/ 347
METRIC RANK
14.7%
NO VEHICLES IN HOUSEHOLD
0.0/ 100
METRIC RATING
298th/ 347
METRIC RANK
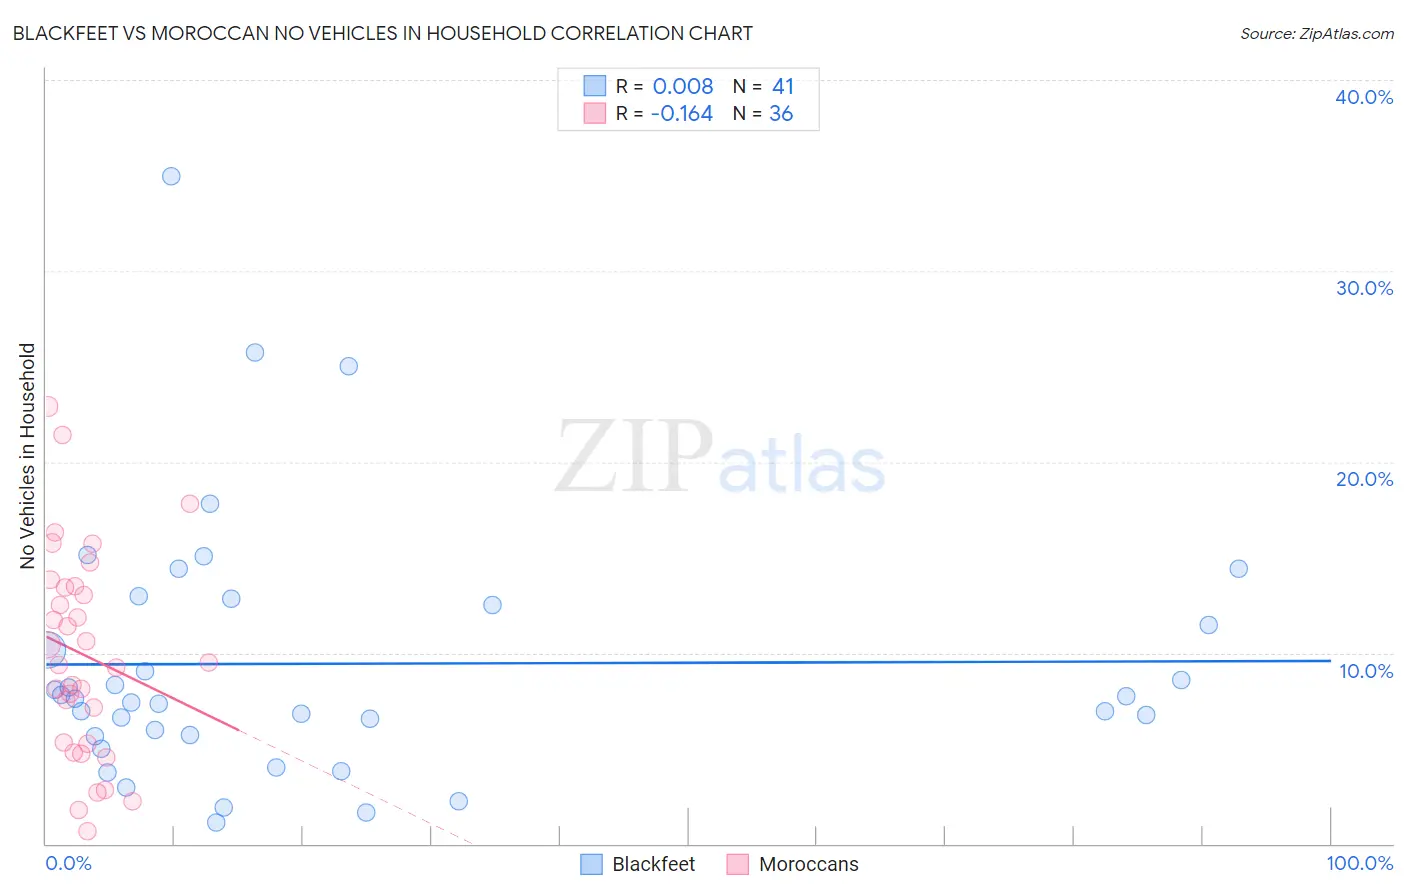
Blackfeet vs Moroccan No Vehicles in Household Correlation Chart
The statistical analysis conducted on geographies consisting of 309,020,066 people shows no correlation between the proportion of Blackfeet and percentage of households with no vehicle available in the United States with a correlation coefficient (R) of 0.008 and weighted average of 9.6%. Similarly, the statistical analysis conducted on geographies consisting of 201,657,116 people shows a poor negative correlation between the proportion of Moroccans and percentage of households with no vehicle available in the United States with a correlation coefficient (R) of -0.164 and weighted average of 14.7%, a difference of 53.2%.
No Vehicles in Household Correlation Summary
| Measurement | Blackfeet | Moroccan |
| Minimum | 1.1% | 0.64% |
| Maximum | 34.9% | 22.9% |
| Range | 33.8% | 22.3% |
| Mean | 9.4% | 9.9% |
| Median | 7.6% | 9.4% |
| Interquartile 25% (IQ1) | 5.7% | 5.3% |
| Interquartile 75% (IQ3) | 12.7% | 13.4% |
| Interquartile Range (IQR) | 7.0% | 8.2% |
| Standard Deviation (Sample) | 6.9% | 5.4% |
| Standard Deviation (Population) | 6.8% | 5.4% |
Similar Demographics by No Vehicles in Household
Demographics Similar to Blackfeet by No Vehicles in Household
In terms of no vehicles in household, the demographic groups most similar to Blackfeet are Immigrants from Korea (9.6%, a difference of 0.23%), Immigrants from Cameroon (9.6%, a difference of 0.36%), Costa Rican (9.5%, a difference of 0.46%), Puget Sound Salish (9.5%, a difference of 0.51%), and Icelander (9.6%, a difference of 0.52%).
| Demographics | Rating | Rank | No Vehicles in Household |
| Japanese | 94.1 /100 | #116 | Exceptional 9.4% |
| Chippewa | 93.8 /100 | #117 | Exceptional 9.4% |
| Greeks | 92.9 /100 | #118 | Exceptional 9.5% |
| Fijians | 92.7 /100 | #119 | Exceptional 9.5% |
| Immigrants | Thailand | 92.6 /100 | #120 | Exceptional 9.5% |
| Puget Sound Salish | 92.4 /100 | #121 | Exceptional 9.5% |
| Costa Ricans | 92.3 /100 | #122 | Exceptional 9.5% |
| Blackfeet | 91.4 /100 | #123 | Exceptional 9.6% |
| Immigrants | Korea | 90.9 /100 | #124 | Exceptional 9.6% |
| Immigrants | Cameroon | 90.6 /100 | #125 | Exceptional 9.6% |
| Icelanders | 90.2 /100 | #126 | Exceptional 9.6% |
| Immigrants | Kenya | 89.7 /100 | #127 | Excellent 9.6% |
| Immigrants | Syria | 89.5 /100 | #128 | Excellent 9.6% |
| Nicaraguans | 89.5 /100 | #129 | Excellent 9.7% |
| Burmese | 88.8 /100 | #130 | Excellent 9.7% |
Demographics Similar to Moroccans by No Vehicles in Household
In terms of no vehicles in household, the demographic groups most similar to Moroccans are Immigrants from Panama (14.6%, a difference of 0.15%), Immigrants from Greece (14.7%, a difference of 0.20%), Immigrants from Spain (14.5%, a difference of 0.82%), Yuman (14.9%, a difference of 1.3%), and Immigrants from Ukraine (14.9%, a difference of 1.3%).
| Demographics | Rating | Rank | No Vehicles in Household |
| Okinawans | 0.0 /100 | #291 | Tragic 14.1% |
| Pima | 0.0 /100 | #292 | Tragic 14.1% |
| Immigrants | Jamaica | 0.0 /100 | #293 | Tragic 14.2% |
| Belizeans | 0.0 /100 | #294 | Tragic 14.3% |
| Paraguayans | 0.0 /100 | #295 | Tragic 14.4% |
| Immigrants | Spain | 0.0 /100 | #296 | Tragic 14.5% |
| Immigrants | Panama | 0.0 /100 | #297 | Tragic 14.6% |
| Moroccans | 0.0 /100 | #298 | Tragic 14.7% |
| Immigrants | Greece | 0.0 /100 | #299 | Tragic 14.7% |
| Yuman | 0.0 /100 | #300 | Tragic 14.9% |
| Immigrants | Ukraine | 0.0 /100 | #301 | Tragic 14.9% |
| Haitians | 0.0 /100 | #302 | Tragic 14.9% |
| Immigrants | Western Africa | 0.0 /100 | #303 | Tragic 15.0% |
| Immigrants | Russia | 0.0 /100 | #304 | Tragic 15.1% |
| Immigrants | China | 0.0 /100 | #305 | Tragic 15.2% |