Bhutanese vs Immigrants from Western Africa No Vehicles in Household
COMPARE
Bhutanese
Immigrants from Western Africa
No Vehicles in Household
No Vehicles in Household Comparison
Bhutanese
Immigrants from Western Africa
8.7%
NO VEHICLES IN HOUSEHOLD
99.2/ 100
METRIC RATING
90th/ 347
METRIC RANK
15.0%
NO VEHICLES IN HOUSEHOLD
0.0/ 100
METRIC RATING
303rd/ 347
METRIC RANK
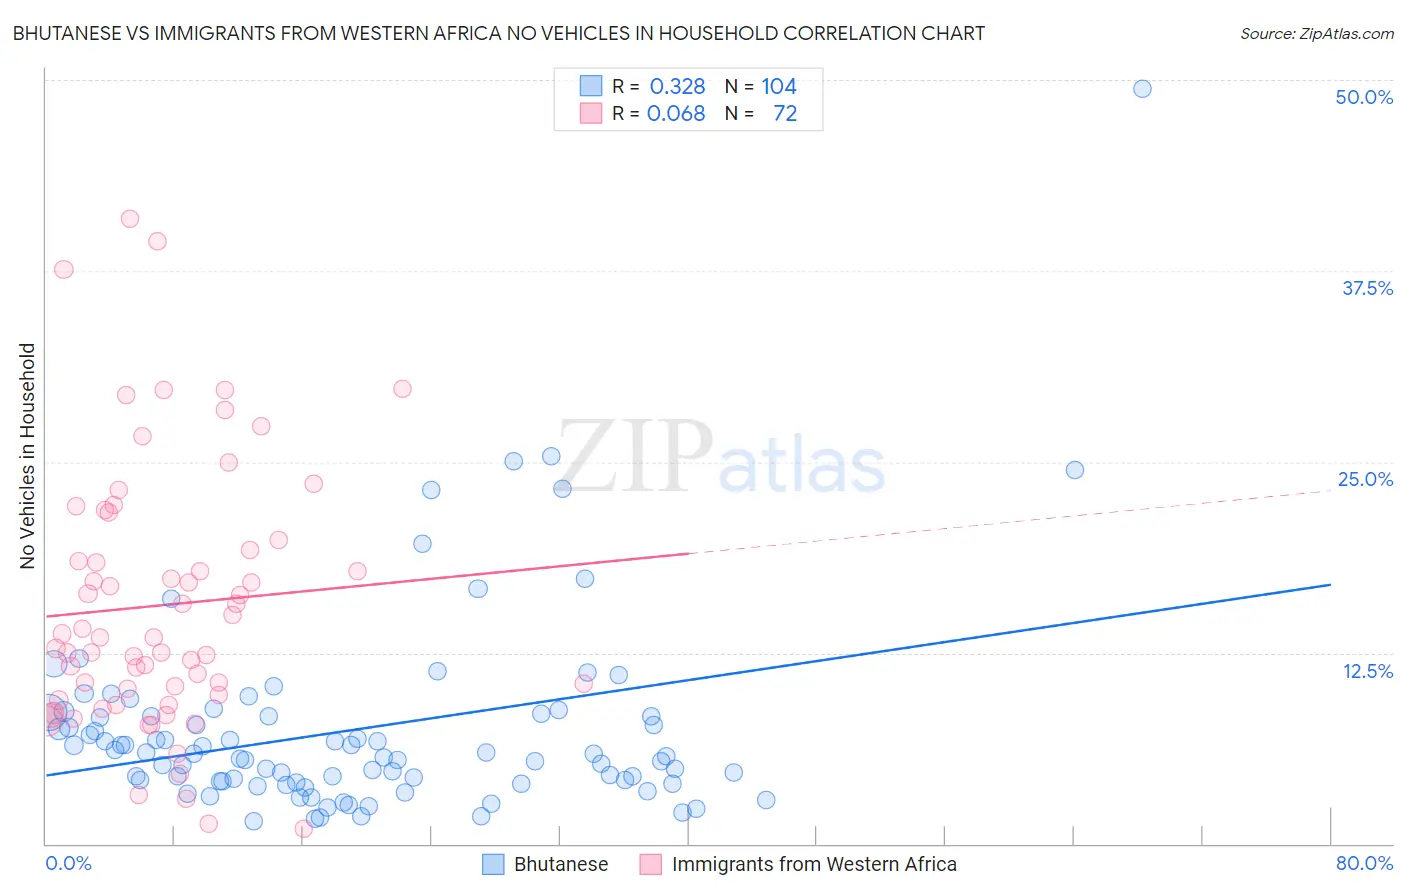
Bhutanese vs Immigrants from Western Africa No Vehicles in Household Correlation Chart
The statistical analysis conducted on geographies consisting of 453,743,315 people shows a mild positive correlation between the proportion of Bhutanese and percentage of households with no vehicle available in the United States with a correlation coefficient (R) of 0.328 and weighted average of 8.7%. Similarly, the statistical analysis conducted on geographies consisting of 356,981,252 people shows a slight positive correlation between the proportion of Immigrants from Western Africa and percentage of households with no vehicle available in the United States with a correlation coefficient (R) of 0.068 and weighted average of 15.0%, a difference of 72.1%.
No Vehicles in Household Correlation Summary
| Measurement | Bhutanese | Immigrants from Western Africa |
| Minimum | 1.5% | 1.0% |
| Maximum | 49.5% | 40.9% |
| Range | 48.0% | 39.9% |
| Mean | 7.5% | 15.6% |
| Median | 5.8% | 13.5% |
| Interquartile 25% (IQ1) | 4.1% | 9.6% |
| Interquartile 75% (IQ3) | 8.3% | 19.6% |
| Interquartile Range (IQR) | 4.3% | 10.0% |
| Standard Deviation (Sample) | 6.6% | 8.6% |
| Standard Deviation (Population) | 6.6% | 8.5% |
Similar Demographics by No Vehicles in Household
Demographics Similar to Bhutanese by No Vehicles in Household
In terms of no vehicles in household, the demographic groups most similar to Bhutanese are Immigrants from Cuba (8.7%, a difference of 0.090%), Immigrants from Germany (8.7%, a difference of 0.19%), Immigrants from Canada (8.7%, a difference of 0.22%), Osage (8.7%, a difference of 0.23%), and Immigrants from England (8.7%, a difference of 0.35%).
| Demographics | Rating | Rank | No Vehicles in Household |
| Italians | 99.4 /100 | #83 | Exceptional 8.6% |
| Immigrants | Jordan | 99.3 /100 | #84 | Exceptional 8.7% |
| Lebanese | 99.3 /100 | #85 | Exceptional 8.7% |
| Bangladeshis | 99.3 /100 | #86 | Exceptional 8.7% |
| Immigrants | England | 99.2 /100 | #87 | Exceptional 8.7% |
| Osage | 99.2 /100 | #88 | Exceptional 8.7% |
| Immigrants | Cuba | 99.2 /100 | #89 | Exceptional 8.7% |
| Bhutanese | 99.2 /100 | #90 | Exceptional 8.7% |
| Immigrants | Germany | 99.1 /100 | #91 | Exceptional 8.7% |
| Immigrants | Canada | 99.1 /100 | #92 | Exceptional 8.7% |
| Immigrants | North America | 99.1 /100 | #93 | Exceptional 8.7% |
| Austrians | 98.9 /100 | #94 | Exceptional 8.8% |
| Potawatomi | 98.8 /100 | #95 | Exceptional 8.8% |
| Immigrants | Bolivia | 98.7 /100 | #96 | Exceptional 8.9% |
| Immigrants | Central America | 98.5 /100 | #97 | Exceptional 8.9% |
Demographics Similar to Immigrants from Western Africa by No Vehicles in Household
In terms of no vehicles in household, the demographic groups most similar to Immigrants from Western Africa are Haitian (14.9%, a difference of 0.52%), Immigrants from Russia (15.1%, a difference of 0.66%), Immigrants from Ukraine (14.9%, a difference of 0.99%), Yuman (14.9%, a difference of 1.0%), and Immigrants from China (15.2%, a difference of 1.0%).
| Demographics | Rating | Rank | No Vehicles in Household |
| Immigrants | Spain | 0.0 /100 | #296 | Tragic 14.5% |
| Immigrants | Panama | 0.0 /100 | #297 | Tragic 14.6% |
| Moroccans | 0.0 /100 | #298 | Tragic 14.7% |
| Immigrants | Greece | 0.0 /100 | #299 | Tragic 14.7% |
| Yuman | 0.0 /100 | #300 | Tragic 14.9% |
| Immigrants | Ukraine | 0.0 /100 | #301 | Tragic 14.9% |
| Haitians | 0.0 /100 | #302 | Tragic 14.9% |
| Immigrants | Western Africa | 0.0 /100 | #303 | Tragic 15.0% |
| Immigrants | Russia | 0.0 /100 | #304 | Tragic 15.1% |
| Immigrants | China | 0.0 /100 | #305 | Tragic 15.2% |
| Immigrants | Belize | 0.0 /100 | #306 | Tragic 15.4% |
| Immigrants | Haiti | 0.0 /100 | #307 | Tragic 15.4% |
| U.S. Virgin Islanders | 0.0 /100 | #308 | Tragic 15.4% |
| Puerto Ricans | 0.0 /100 | #309 | Tragic 15.5% |
| Cape Verdeans | 0.0 /100 | #310 | Tragic 15.6% |