Bhutanese vs Immigrants from Western Africa College, 1 year or more
COMPARE
Bhutanese
Immigrants from Western Africa
College, 1 year or more
College, 1 year or more Comparison
Bhutanese
Immigrants from Western Africa
64.6%
COLLEGE, 1 YEAR OR MORE
99.9/ 100
METRIC RATING
46th/ 347
METRIC RANK
57.0%
COLLEGE, 1 YEAR OR MORE
4.6/ 100
METRIC RATING
226th/ 347
METRIC RANK
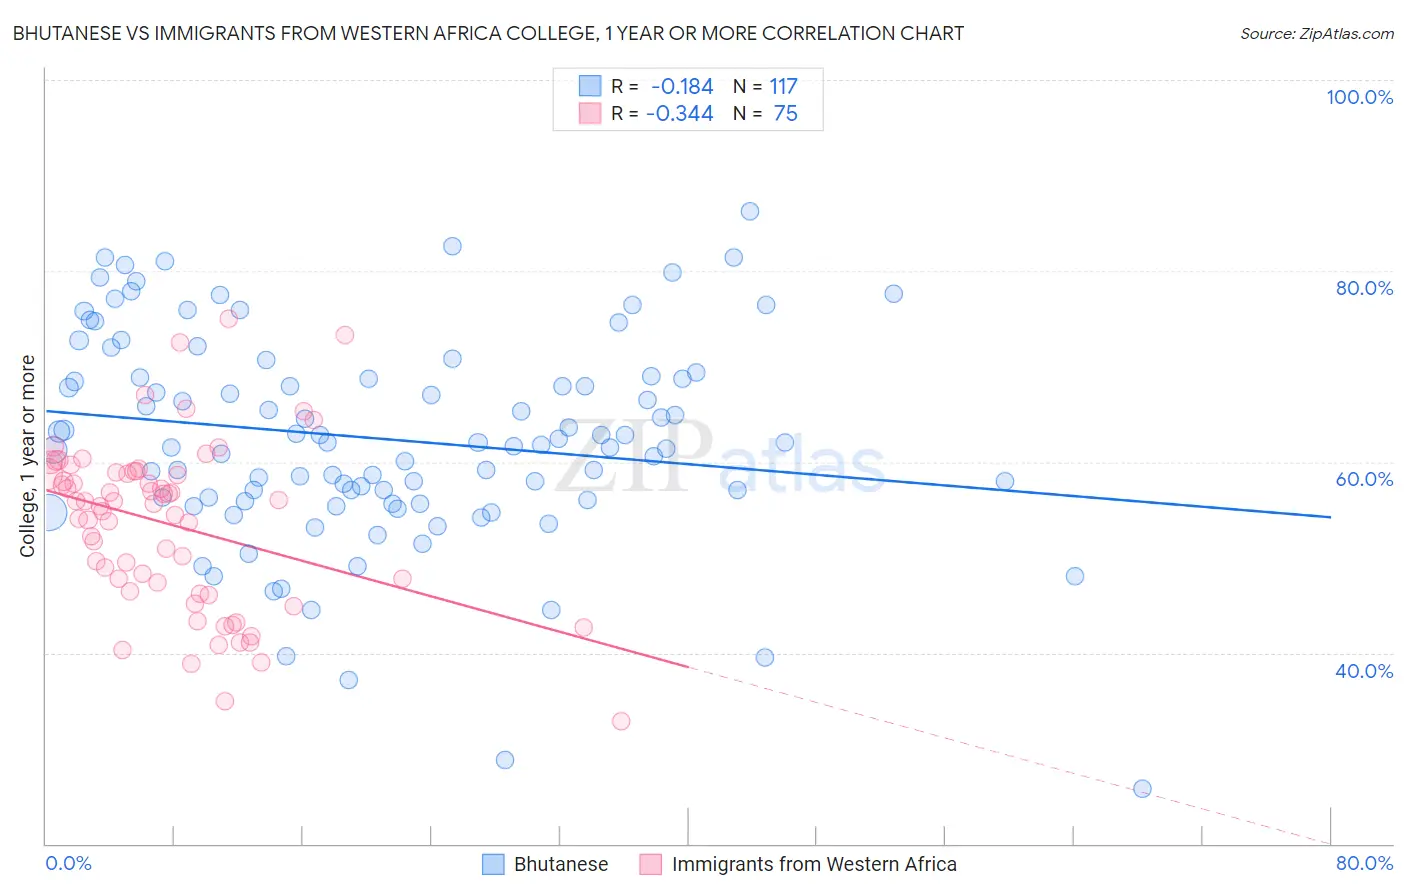
Bhutanese vs Immigrants from Western Africa College, 1 year or more Correlation Chart
The statistical analysis conducted on geographies consisting of 455,588,587 people shows a poor negative correlation between the proportion of Bhutanese and percentage of population with at least college, 1 year or more education in the United States with a correlation coefficient (R) of -0.184 and weighted average of 64.6%. Similarly, the statistical analysis conducted on geographies consisting of 357,885,062 people shows a mild negative correlation between the proportion of Immigrants from Western Africa and percentage of population with at least college, 1 year or more education in the United States with a correlation coefficient (R) of -0.344 and weighted average of 57.0%, a difference of 13.3%.
College, 1 year or more Correlation Summary
| Measurement | Bhutanese | Immigrants from Western Africa |
| Minimum | 25.7% | 32.8% |
| Maximum | 86.2% | 75.0% |
| Range | 60.5% | 42.2% |
| Mean | 62.4% | 53.4% |
| Median | 62.0% | 55.6% |
| Interquartile 25% (IQ1) | 55.9% | 46.4% |
| Interquartile 75% (IQ3) | 69.0% | 58.9% |
| Interquartile Range (IQR) | 13.0% | 12.5% |
| Standard Deviation (Sample) | 11.1% | 8.7% |
| Standard Deviation (Population) | 11.1% | 8.7% |
Similar Demographics by College, 1 year or more
Demographics Similar to Bhutanese by College, 1 year or more
In terms of college, 1 year or more, the demographic groups most similar to Bhutanese are Immigrants from Lithuania (64.6%, a difference of 0.010%), Australian (64.6%, a difference of 0.010%), Immigrants from Bulgaria (64.6%, a difference of 0.040%), New Zealander (64.6%, a difference of 0.070%), and Immigrants from Norway (64.7%, a difference of 0.18%).
| Demographics | Rating | Rank | College, 1 year or more |
| Estonians | 99.9 /100 | #39 | Exceptional 65.0% |
| Immigrants | Kuwait | 99.9 /100 | #40 | Exceptional 65.0% |
| Mongolians | 99.9 /100 | #41 | Exceptional 64.8% |
| Immigrants | Latvia | 99.9 /100 | #42 | Exceptional 64.8% |
| Immigrants | Russia | 99.9 /100 | #43 | Exceptional 64.7% |
| Immigrants | Norway | 99.9 /100 | #44 | Exceptional 64.7% |
| Immigrants | Lithuania | 99.9 /100 | #45 | Exceptional 64.6% |
| Bhutanese | 99.9 /100 | #46 | Exceptional 64.6% |
| Australians | 99.9 /100 | #47 | Exceptional 64.6% |
| Immigrants | Bulgaria | 99.9 /100 | #48 | Exceptional 64.6% |
| New Zealanders | 99.9 /100 | #49 | Exceptional 64.6% |
| Immigrants | Austria | 99.8 /100 | #50 | Exceptional 64.4% |
| Immigrants | Malaysia | 99.8 /100 | #51 | Exceptional 64.3% |
| Immigrants | Netherlands | 99.8 /100 | #52 | Exceptional 64.2% |
| Asians | 99.8 /100 | #53 | Exceptional 64.2% |
Demographics Similar to Immigrants from Western Africa by College, 1 year or more
In terms of college, 1 year or more, the demographic groups most similar to Immigrants from Western Africa are Vietnamese (57.0%, a difference of 0.030%), Immigrants (57.0%, a difference of 0.070%), Immigrants from Fiji (56.9%, a difference of 0.21%), Portuguese (57.2%, a difference of 0.23%), and Hmong (57.2%, a difference of 0.23%).
| Demographics | Rating | Rank | College, 1 year or more |
| Whites/Caucasians | 8.7 /100 | #219 | Tragic 57.6% |
| Immigrants | Costa Rica | 8.0 /100 | #220 | Tragic 57.5% |
| Immigrants | Ghana | 7.7 /100 | #221 | Tragic 57.4% |
| Sub-Saharan Africans | 6.1 /100 | #222 | Tragic 57.3% |
| Portuguese | 5.4 /100 | #223 | Tragic 57.2% |
| Hmong | 5.4 /100 | #224 | Tragic 57.2% |
| Vietnamese | 4.7 /100 | #225 | Tragic 57.0% |
| Immigrants | Western Africa | 4.6 /100 | #226 | Tragic 57.0% |
| Immigrants | Immigrants | 4.4 /100 | #227 | Tragic 57.0% |
| Immigrants | Fiji | 4.0 /100 | #228 | Tragic 56.9% |
| Cree | 3.6 /100 | #229 | Tragic 56.8% |
| Liberians | 3.1 /100 | #230 | Tragic 56.7% |
| Immigrants | Burma/Myanmar | 2.7 /100 | #231 | Tragic 56.6% |
| Immigrants | Bangladesh | 2.6 /100 | #232 | Tragic 56.6% |
| Immigrants | Nonimmigrants | 2.5 /100 | #233 | Tragic 56.5% |