Immigrants from Portugal vs Immigrants from Western Africa No Vehicles in Household
COMPARE
Immigrants from Portugal
Immigrants from Western Africa
No Vehicles in Household
No Vehicles in Household Comparison
Immigrants from Portugal
Immigrants from Western Africa
11.7%
NO VEHICLES IN HOUSEHOLD
2.2/ 100
METRIC RATING
244th/ 347
METRIC RANK
15.0%
NO VEHICLES IN HOUSEHOLD
0.0/ 100
METRIC RATING
303rd/ 347
METRIC RANK
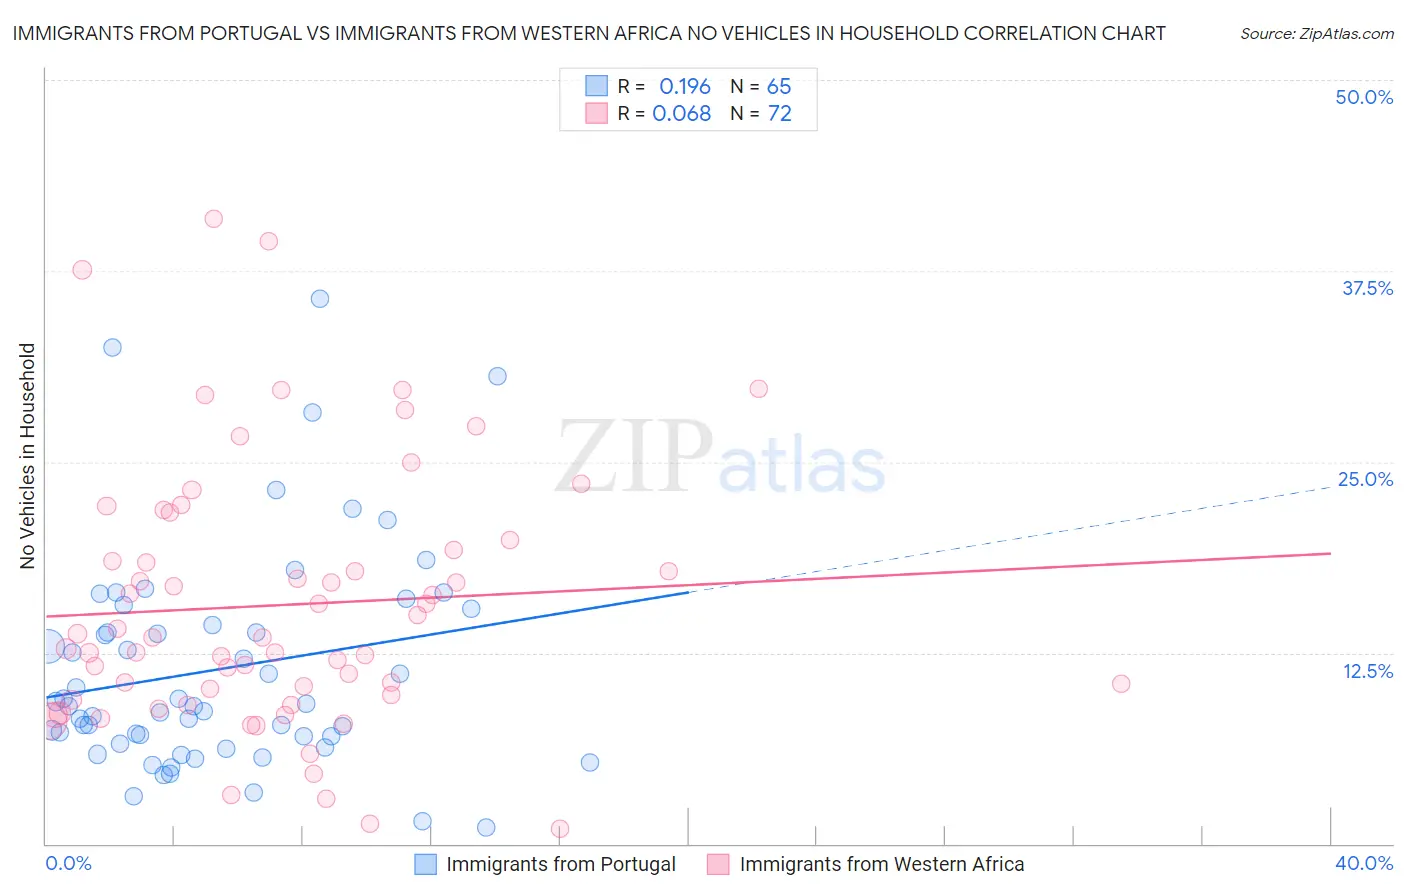
Immigrants from Portugal vs Immigrants from Western Africa No Vehicles in Household Correlation Chart
The statistical analysis conducted on geographies consisting of 174,581,030 people shows a poor positive correlation between the proportion of Immigrants from Portugal and percentage of households with no vehicle available in the United States with a correlation coefficient (R) of 0.196 and weighted average of 11.7%. Similarly, the statistical analysis conducted on geographies consisting of 356,981,252 people shows a slight positive correlation between the proportion of Immigrants from Western Africa and percentage of households with no vehicle available in the United States with a correlation coefficient (R) of 0.068 and weighted average of 15.0%, a difference of 27.8%.
No Vehicles in Household Correlation Summary
| Measurement | Immigrants from Portugal | Immigrants from Western Africa |
| Minimum | 1.1% | 1.0% |
| Maximum | 35.7% | 40.9% |
| Range | 34.6% | 39.9% |
| Mean | 11.4% | 15.6% |
| Median | 9.0% | 13.5% |
| Interquartile 25% (IQ1) | 6.8% | 9.6% |
| Interquartile 75% (IQ3) | 14.9% | 19.6% |
| Interquartile Range (IQR) | 8.1% | 10.0% |
| Standard Deviation (Sample) | 7.2% | 8.6% |
| Standard Deviation (Population) | 7.1% | 8.5% |
Similar Demographics by No Vehicles in Household
Demographics Similar to Immigrants from Portugal by No Vehicles in Household
In terms of no vehicles in household, the demographic groups most similar to Immigrants from Portugal are Cheyenne (11.7%, a difference of 0.18%), Immigrants from Honduras (11.8%, a difference of 0.19%), Menominee (11.8%, a difference of 0.36%), Immigrants from Czechoslovakia (11.8%, a difference of 0.41%), and Immigrants from Belgium (11.8%, a difference of 0.42%).
| Demographics | Rating | Rank | No Vehicles in Household |
| Ute | 3.3 /100 | #237 | Tragic 11.6% |
| Russians | 3.2 /100 | #238 | Tragic 11.6% |
| Taiwanese | 2.8 /100 | #239 | Tragic 11.7% |
| Immigrants | Immigrants | 2.7 /100 | #240 | Tragic 11.7% |
| Eastern Europeans | 2.7 /100 | #241 | Tragic 11.7% |
| Turks | 2.6 /100 | #242 | Tragic 11.7% |
| Cheyenne | 2.4 /100 | #243 | Tragic 11.7% |
| Immigrants | Portugal | 2.2 /100 | #244 | Tragic 11.7% |
| Immigrants | Honduras | 2.1 /100 | #245 | Tragic 11.8% |
| Menominee | 2.0 /100 | #246 | Tragic 11.8% |
| Immigrants | Czechoslovakia | 2.0 /100 | #247 | Tragic 11.8% |
| Immigrants | Belgium | 1.9 /100 | #248 | Tragic 11.8% |
| Immigrants | Nigeria | 1.9 /100 | #249 | Tragic 11.8% |
| Paiute | 1.8 /100 | #250 | Tragic 11.8% |
| Blacks/African Americans | 1.6 /100 | #251 | Tragic 11.9% |
Demographics Similar to Immigrants from Western Africa by No Vehicles in Household
In terms of no vehicles in household, the demographic groups most similar to Immigrants from Western Africa are Haitian (14.9%, a difference of 0.52%), Immigrants from Russia (15.1%, a difference of 0.66%), Immigrants from Ukraine (14.9%, a difference of 0.99%), Yuman (14.9%, a difference of 1.0%), and Immigrants from China (15.2%, a difference of 1.0%).
| Demographics | Rating | Rank | No Vehicles in Household |
| Immigrants | Spain | 0.0 /100 | #296 | Tragic 14.5% |
| Immigrants | Panama | 0.0 /100 | #297 | Tragic 14.6% |
| Moroccans | 0.0 /100 | #298 | Tragic 14.7% |
| Immigrants | Greece | 0.0 /100 | #299 | Tragic 14.7% |
| Yuman | 0.0 /100 | #300 | Tragic 14.9% |
| Immigrants | Ukraine | 0.0 /100 | #301 | Tragic 14.9% |
| Haitians | 0.0 /100 | #302 | Tragic 14.9% |
| Immigrants | Western Africa | 0.0 /100 | #303 | Tragic 15.0% |
| Immigrants | Russia | 0.0 /100 | #304 | Tragic 15.1% |
| Immigrants | China | 0.0 /100 | #305 | Tragic 15.2% |
| Immigrants | Belize | 0.0 /100 | #306 | Tragic 15.4% |
| Immigrants | Haiti | 0.0 /100 | #307 | Tragic 15.4% |
| U.S. Virgin Islanders | 0.0 /100 | #308 | Tragic 15.4% |
| Puerto Ricans | 0.0 /100 | #309 | Tragic 15.5% |
| Cape Verdeans | 0.0 /100 | #310 | Tragic 15.6% |