Immigrants from Switzerland vs Immigrants from Pakistan 1 or more Vehicles in Household
COMPARE
Immigrants from Switzerland
Immigrants from Pakistan
1 or more Vehicles in Household
1 or more Vehicles in Household Comparison
Immigrants from Switzerland
Immigrants from Pakistan
87.9%
1 OR MORE VEHICLES IN HOUSEHOLD
0.6/ 100
METRIC RATING
261st/ 347
METRIC RANK
88.6%
1 OR MORE VEHICLES IN HOUSEHOLD
4.5/ 100
METRIC RATING
236th/ 347
METRIC RANK
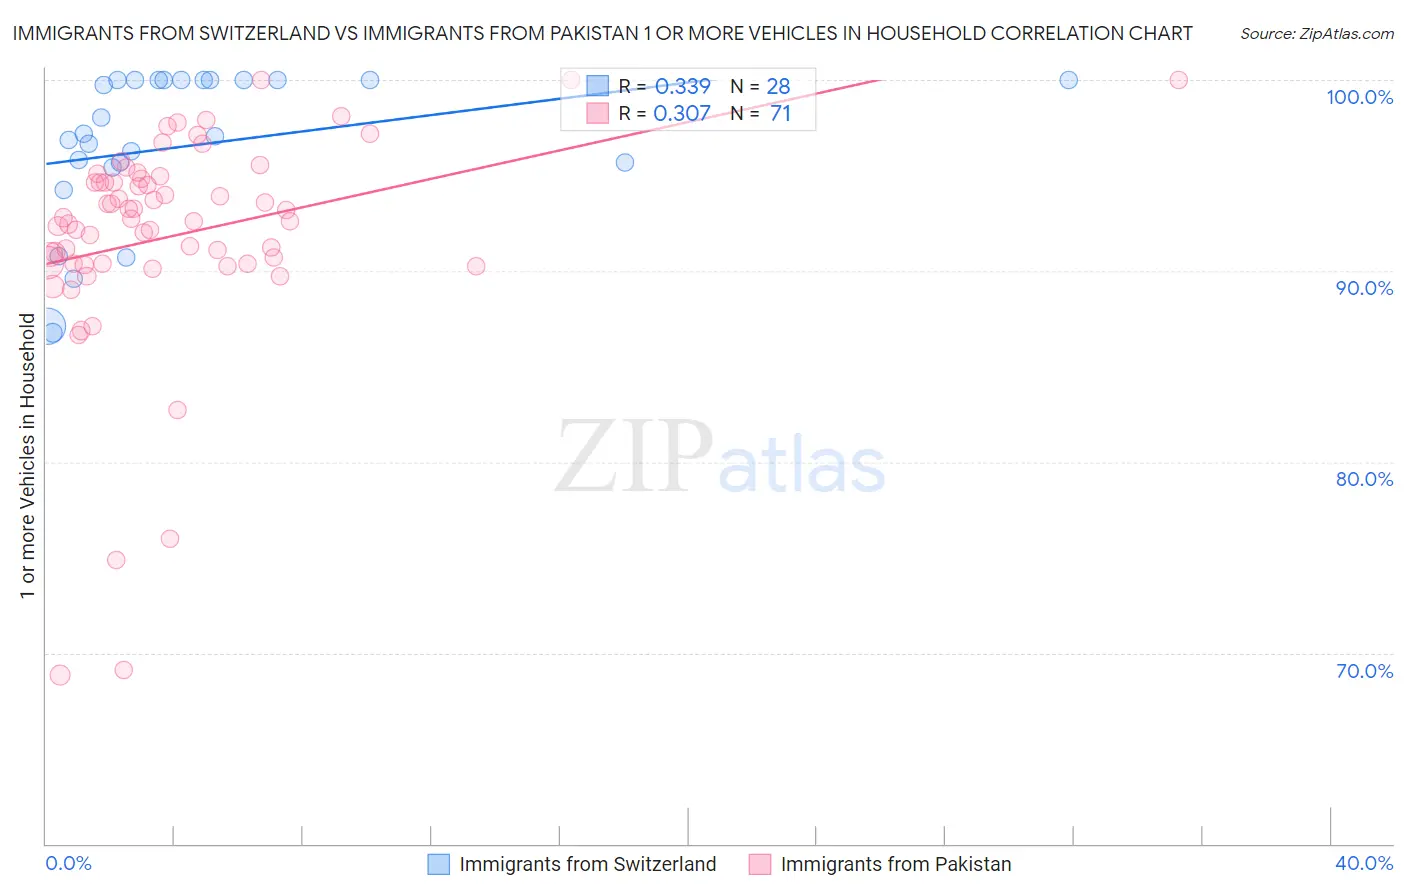
Immigrants from Switzerland vs Immigrants from Pakistan 1 or more Vehicles in Household Correlation Chart
The statistical analysis conducted on geographies consisting of 148,062,168 people shows a mild positive correlation between the proportion of Immigrants from Switzerland and percentage of households with 1 or more vehicles available in the United States with a correlation coefficient (R) of 0.339 and weighted average of 87.9%. Similarly, the statistical analysis conducted on geographies consisting of 283,704,699 people shows a mild positive correlation between the proportion of Immigrants from Pakistan and percentage of households with 1 or more vehicles available in the United States with a correlation coefficient (R) of 0.307 and weighted average of 88.6%, a difference of 0.82%.
1 or more Vehicles in Household Correlation Summary
| Measurement | Immigrants from Switzerland | Immigrants from Pakistan |
| Minimum | 86.7% | 68.8% |
| Maximum | 100.0% | 100.0% |
| Range | 13.3% | 31.2% |
| Mean | 96.6% | 91.9% |
| Median | 97.1% | 92.7% |
| Interquartile 25% (IQ1) | 95.5% | 90.4% |
| Interquartile 75% (IQ3) | 100.0% | 94.8% |
| Interquartile Range (IQR) | 4.5% | 4.4% |
| Standard Deviation (Sample) | 4.1% | 5.9% |
| Standard Deviation (Population) | 4.0% | 5.8% |
Similar Demographics by 1 or more Vehicles in Household
Demographics Similar to Immigrants from Switzerland by 1 or more Vehicles in Household
In terms of 1 or more vehicles in household, the demographic groups most similar to Immigrants from Switzerland are Subsaharan African (87.9%, a difference of 0.030%), Macedonian (87.9%, a difference of 0.040%), Immigrants from Egypt (87.8%, a difference of 0.10%), Immigrants from Liberia (87.8%, a difference of 0.11%), and Nigerian (88.0%, a difference of 0.13%).
| Demographics | Rating | Rank | 1 or more Vehicles in Household |
| Haitians | 0.9 /100 | #254 | Tragic 88.1% |
| Immigrants | Latvia | 0.9 /100 | #255 | Tragic 88.1% |
| Colombians | 0.9 /100 | #256 | Tragic 88.0% |
| Liberians | 0.9 /100 | #257 | Tragic 88.0% |
| South American Indians | 0.9 /100 | #258 | Tragic 88.0% |
| Nigerians | 0.8 /100 | #259 | Tragic 88.0% |
| Macedonians | 0.6 /100 | #260 | Tragic 87.9% |
| Immigrants | Switzerland | 0.6 /100 | #261 | Tragic 87.9% |
| Sub-Saharan Africans | 0.5 /100 | #262 | Tragic 87.9% |
| Immigrants | Egypt | 0.5 /100 | #263 | Tragic 87.8% |
| Immigrants | Liberia | 0.4 /100 | #264 | Tragic 87.8% |
| Africans | 0.4 /100 | #265 | Tragic 87.8% |
| Israelis | 0.3 /100 | #266 | Tragic 87.7% |
| Immigrants | Colombia | 0.3 /100 | #267 | Tragic 87.6% |
| Immigrants | Europe | 0.2 /100 | #268 | Tragic 87.6% |
Demographics Similar to Immigrants from Pakistan by 1 or more Vehicles in Household
In terms of 1 or more vehicles in household, the demographic groups most similar to Immigrants from Pakistan are Paiute (88.6%, a difference of 0.010%), Immigrants from Turkey (88.6%, a difference of 0.010%), Immigrants from Peru (88.6%, a difference of 0.020%), Houma (88.6%, a difference of 0.030%), and Immigrants from Somalia (88.6%, a difference of 0.030%).
| Demographics | Rating | Rank | 1 or more Vehicles in Household |
| Immigrants | Romania | 5.4 /100 | #229 | Tragic 88.7% |
| Immigrants | Sierra Leone | 5.2 /100 | #230 | Tragic 88.7% |
| Russians | 5.0 /100 | #231 | Tragic 88.7% |
| Immigrants | Japan | 4.9 /100 | #232 | Tragic 88.7% |
| Houma | 4.8 /100 | #233 | Tragic 88.6% |
| Immigrants | Peru | 4.7 /100 | #234 | Tragic 88.6% |
| Paiute | 4.6 /100 | #235 | Tragic 88.6% |
| Immigrants | Pakistan | 4.5 /100 | #236 | Tragic 88.6% |
| Immigrants | Turkey | 4.4 /100 | #237 | Tragic 88.6% |
| Immigrants | Somalia | 4.2 /100 | #238 | Tragic 88.6% |
| Kiowa | 3.8 /100 | #239 | Tragic 88.6% |
| Eastern Europeans | 3.0 /100 | #240 | Tragic 88.5% |
| Taiwanese | 2.6 /100 | #241 | Tragic 88.4% |
| Turks | 2.5 /100 | #242 | Tragic 88.4% |
| Immigrants | Belgium | 2.1 /100 | #243 | Tragic 88.4% |