Basque vs Immigrants from Pakistan In Labor Force | Age 16-19
COMPARE
Basque
Immigrants from Pakistan
In Labor Force | Age 16-19
In Labor Force | Age 16-19 Comparison
Basques
Immigrants from Pakistan
39.3%
IN LABOR FORCE | AGE 16-19
99.7/ 100
METRIC RATING
82nd/ 347
METRIC RANK
34.8%
IN LABOR FORCE | AGE 16-19
2.0/ 100
METRIC RATING
250th/ 347
METRIC RANK
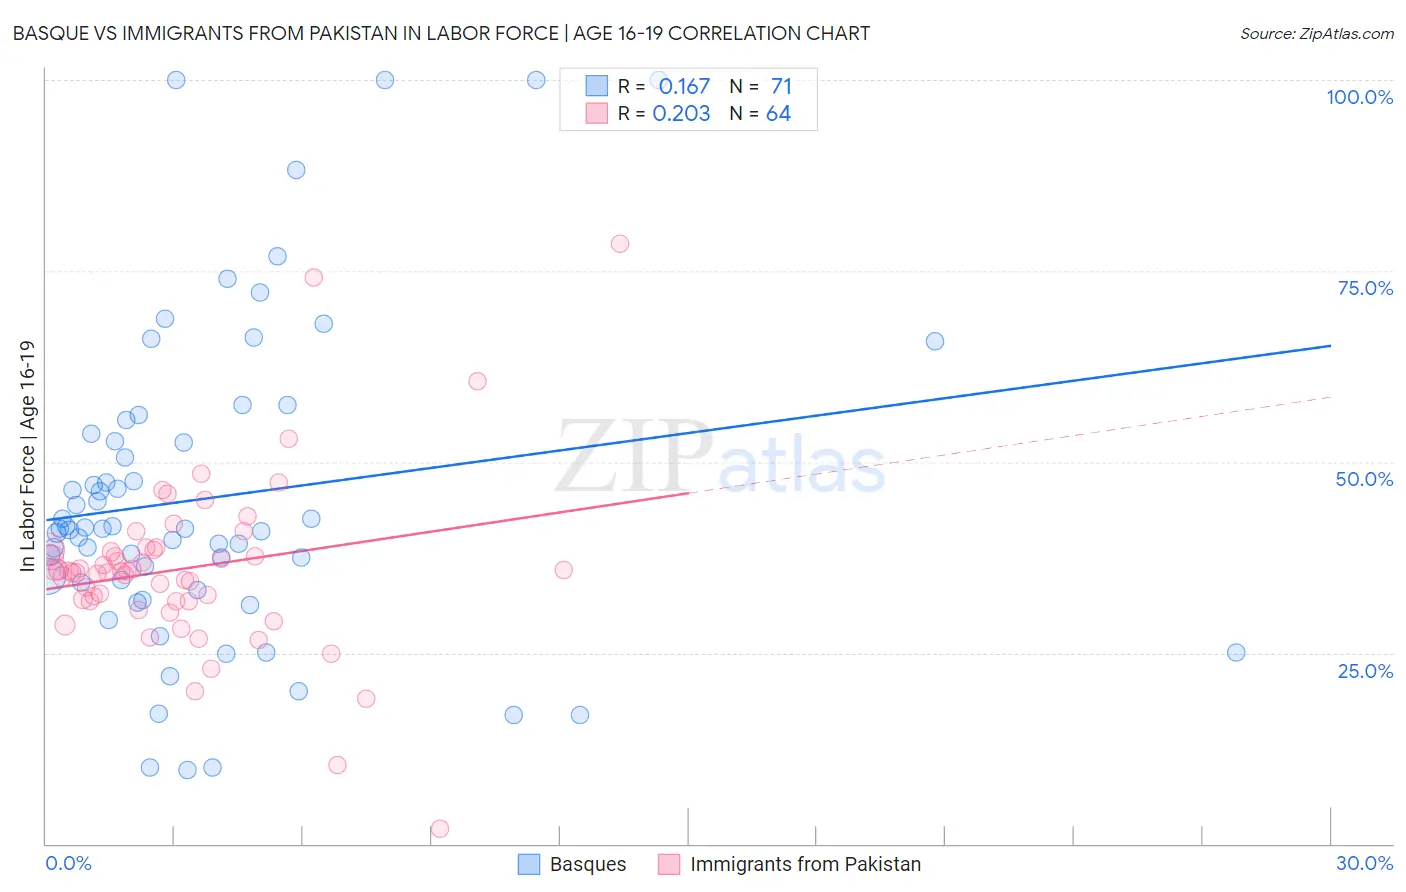
Basque vs Immigrants from Pakistan In Labor Force | Age 16-19 Correlation Chart
The statistical analysis conducted on geographies consisting of 165,637,018 people shows a poor positive correlation between the proportion of Basques and labor force participation rate among population between the ages 16 and 19 in the United States with a correlation coefficient (R) of 0.167 and weighted average of 39.3%. Similarly, the statistical analysis conducted on geographies consisting of 283,687,776 people shows a weak positive correlation between the proportion of Immigrants from Pakistan and labor force participation rate among population between the ages 16 and 19 in the United States with a correlation coefficient (R) of 0.203 and weighted average of 34.8%, a difference of 12.9%.
In Labor Force | Age 16-19 Correlation Summary
| Measurement | Basque | Immigrants from Pakistan |
| Minimum | 9.7% | 2.0% |
| Maximum | 100.0% | 78.6% |
| Range | 90.3% | 76.6% |
| Mean | 45.3% | 36.0% |
| Median | 41.3% | 35.7% |
| Interquartile 25% (IQ1) | 34.2% | 31.8% |
| Interquartile 75% (IQ3) | 53.7% | 38.5% |
| Interquartile Range (IQR) | 19.5% | 6.7% |
| Standard Deviation (Sample) | 20.8% | 11.4% |
| Standard Deviation (Population) | 20.7% | 11.3% |
Similar Demographics by In Labor Force | Age 16-19
Demographics Similar to Basques by In Labor Force | Age 16-19
In terms of in labor force | age 16-19, the demographic groups most similar to Basques are Spanish (39.3%, a difference of 0.020%), Shoshone (39.3%, a difference of 0.060%), Immigrants from Uganda (39.2%, a difference of 0.15%), Creek (39.1%, a difference of 0.30%), and Samoan (39.1%, a difference of 0.32%).
| Demographics | Rating | Rank | In Labor Force | Age 16-19 |
| French American Indians | 99.9 /100 | #75 | Exceptional 39.8% |
| Malaysians | 99.9 /100 | #76 | Exceptional 39.7% |
| Immigrants | Portugal | 99.9 /100 | #77 | Exceptional 39.7% |
| Austrians | 99.8 /100 | #78 | Exceptional 39.5% |
| Marshallese | 99.8 /100 | #79 | Exceptional 39.5% |
| Immigrants | Iraq | 99.8 /100 | #80 | Exceptional 39.4% |
| Shoshone | 99.7 /100 | #81 | Exceptional 39.3% |
| Basques | 99.7 /100 | #82 | Exceptional 39.3% |
| Spanish | 99.7 /100 | #83 | Exceptional 39.3% |
| Immigrants | Uganda | 99.7 /100 | #84 | Exceptional 39.2% |
| Creek | 99.6 /100 | #85 | Exceptional 39.1% |
| Samoans | 99.6 /100 | #86 | Exceptional 39.1% |
| Immigrants | Germany | 99.6 /100 | #87 | Exceptional 39.1% |
| Puget Sound Salish | 99.6 /100 | #88 | Exceptional 39.1% |
| Alaska Natives | 99.6 /100 | #89 | Exceptional 39.1% |
Demographics Similar to Immigrants from Pakistan by In Labor Force | Age 16-19
In terms of in labor force | age 16-19, the demographic groups most similar to Immigrants from Pakistan are Immigrants from Western Asia (34.8%, a difference of 0.020%), Immigrants from Chile (34.8%, a difference of 0.030%), Immigrants from Ukraine (34.8%, a difference of 0.10%), Central American (34.8%, a difference of 0.13%), and Laotian (34.9%, a difference of 0.21%).
| Demographics | Rating | Rank | In Labor Force | Age 16-19 |
| Pueblo | 2.6 /100 | #243 | Tragic 34.9% |
| Immigrants | Turkey | 2.6 /100 | #244 | Tragic 34.9% |
| Immigrants | Greece | 2.4 /100 | #245 | Tragic 34.9% |
| Immigrants | Sri Lanka | 2.4 /100 | #246 | Tragic 34.9% |
| Laotians | 2.4 /100 | #247 | Tragic 34.9% |
| Central Americans | 2.2 /100 | #248 | Tragic 34.8% |
| Immigrants | Ukraine | 2.2 /100 | #249 | Tragic 34.8% |
| Immigrants | Pakistan | 2.0 /100 | #250 | Tragic 34.8% |
| Immigrants | Western Asia | 2.0 /100 | #251 | Tragic 34.8% |
| Immigrants | Chile | 2.0 /100 | #252 | Tragic 34.8% |
| Immigrants | Japan | 1.5 /100 | #253 | Tragic 34.7% |
| Bahamians | 1.4 /100 | #254 | Tragic 34.6% |
| Peruvians | 1.4 /100 | #255 | Tragic 34.6% |
| Immigrants | South Central Asia | 1.3 /100 | #256 | Tragic 34.6% |
| Immigrants | Egypt | 1.2 /100 | #257 | Tragic 34.6% |