Barbadian vs Austrian 1 or more Vehicles in Household
COMPARE
Barbadian
Austrian
1 or more Vehicles in Household
1 or more Vehicles in Household Comparison
Barbadians
Austrians
74.0%
1 OR MORE VEHICLES IN HOUSEHOLD
0.0/ 100
METRIC RATING
335th/ 347
METRIC RANK
91.3%
1 OR MORE VEHICLES IN HOUSEHOLD
99.0/ 100
METRIC RATING
95th/ 347
METRIC RANK
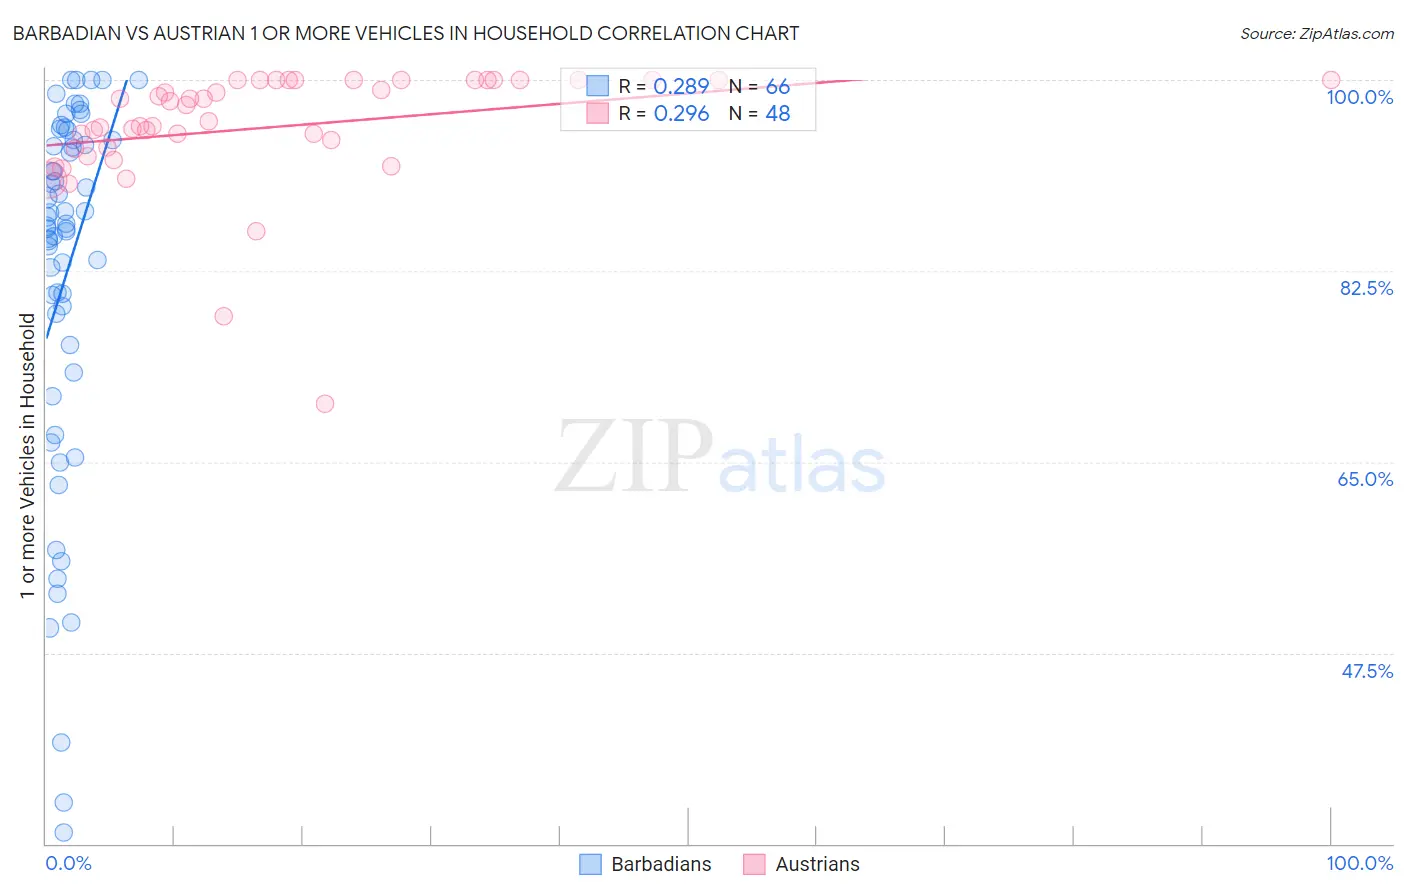
Barbadian vs Austrian 1 or more Vehicles in Household Correlation Chart
The statistical analysis conducted on geographies consisting of 141,288,849 people shows a weak positive correlation between the proportion of Barbadians and percentage of households with 1 or more vehicles available in the United States with a correlation coefficient (R) of 0.289 and weighted average of 74.0%. Similarly, the statistical analysis conducted on geographies consisting of 451,869,761 people shows a weak positive correlation between the proportion of Austrians and percentage of households with 1 or more vehicles available in the United States with a correlation coefficient (R) of 0.296 and weighted average of 91.3%, a difference of 23.4%.
1 or more Vehicles in Household Correlation Summary
| Measurement | Barbadian | Austrian |
| Minimum | 31.0% | 70.3% |
| Maximum | 100.0% | 100.0% |
| Range | 69.0% | 29.7% |
| Mean | 82.0% | 95.7% |
| Median | 86.7% | 97.0% |
| Interquartile 25% (IQ1) | 75.7% | 93.8% |
| Interquartile 75% (IQ3) | 94.5% | 100.0% |
| Interquartile Range (IQR) | 18.8% | 6.2% |
| Standard Deviation (Sample) | 17.0% | 5.7% |
| Standard Deviation (Population) | 16.9% | 5.6% |
Similar Demographics by 1 or more Vehicles in Household
Demographics Similar to Barbadians by 1 or more Vehicles in Household
In terms of 1 or more vehicles in household, the demographic groups most similar to Barbadians are Vietnamese (73.8%, a difference of 0.21%), Immigrants from Bangladesh (74.3%, a difference of 0.44%), Immigrants from Uzbekistan (73.4%, a difference of 0.82%), Immigrants from Ecuador (76.2%, a difference of 3.0%), and Trinidadian and Tobagonian (76.3%, a difference of 3.2%).
| Demographics | Rating | Rank | 1 or more Vehicles in Household |
| Ecuadorians | 0.0 /100 | #328 | Tragic 77.9% |
| Immigrants | Dominica | 0.0 /100 | #329 | Tragic 77.8% |
| Immigrants | Trinidad and Tobago | 0.0 /100 | #330 | Tragic 76.8% |
| West Indians | 0.0 /100 | #331 | Tragic 76.4% |
| Trinidadians and Tobagonians | 0.0 /100 | #332 | Tragic 76.3% |
| Immigrants | Ecuador | 0.0 /100 | #333 | Tragic 76.2% |
| Immigrants | Bangladesh | 0.0 /100 | #334 | Tragic 74.3% |
| Barbadians | 0.0 /100 | #335 | Tragic 74.0% |
| Vietnamese | 0.0 /100 | #336 | Tragic 73.8% |
| Immigrants | Uzbekistan | 0.0 /100 | #337 | Tragic 73.4% |
| Inupiat | 0.0 /100 | #338 | Tragic 71.5% |
| Guyanese | 0.0 /100 | #339 | Tragic 70.8% |
| Dominicans | 0.0 /100 | #340 | Tragic 70.7% |
| Immigrants | Barbados | 0.0 /100 | #341 | Tragic 70.6% |
| Immigrants | Guyana | 0.0 /100 | #342 | Tragic 70.6% |
Demographics Similar to Austrians by 1 or more Vehicles in Household
In terms of 1 or more vehicles in household, the demographic groups most similar to Austrians are Immigrants from Cuba (91.3%, a difference of 0.010%), Potawatomi (91.3%, a difference of 0.010%), Pakistani (91.3%, a difference of 0.020%), Immigrants from North America (91.4%, a difference of 0.070%), and Bangladeshi (91.4%, a difference of 0.080%).
| Demographics | Rating | Rank | 1 or more Vehicles in Household |
| Spanish Americans | 99.2 /100 | #88 | Exceptional 91.4% |
| Bangladeshis | 99.2 /100 | #89 | Exceptional 91.4% |
| Immigrants | Canada | 99.2 /100 | #90 | Exceptional 91.4% |
| Immigrants | Jordan | 99.2 /100 | #91 | Exceptional 91.4% |
| Bhutanese | 99.2 /100 | #92 | Exceptional 91.4% |
| Immigrants | North America | 99.2 /100 | #93 | Exceptional 91.4% |
| Immigrants | Cuba | 99.1 /100 | #94 | Exceptional 91.3% |
| Austrians | 99.0 /100 | #95 | Exceptional 91.3% |
| Potawatomi | 99.0 /100 | #96 | Exceptional 91.3% |
| Pakistanis | 99.0 /100 | #97 | Exceptional 91.3% |
| Slavs | 98.7 /100 | #98 | Exceptional 91.2% |
| Immigrants | Bolivia | 98.6 /100 | #99 | Exceptional 91.2% |
| Immigrants | Central America | 98.4 /100 | #100 | Exceptional 91.1% |
| Bulgarians | 98.4 /100 | #101 | Exceptional 91.1% |
| Seminole | 98.3 /100 | #102 | Exceptional 91.1% |