Bahamian vs Tlingit-Haida No Vehicles in Household
COMPARE
Bahamian
Tlingit-Haida
No Vehicles in Household
No Vehicles in Household Comparison
Bahamians
Tlingit-Haida
9.9%
NO VEHICLES IN HOUSEHOLD
81.0/ 100
METRIC RATING
145th/ 347
METRIC RANK
10.1%
NO VEHICLES IN HOUSEHOLD
72.5/ 100
METRIC RATING
153rd/ 347
METRIC RANK
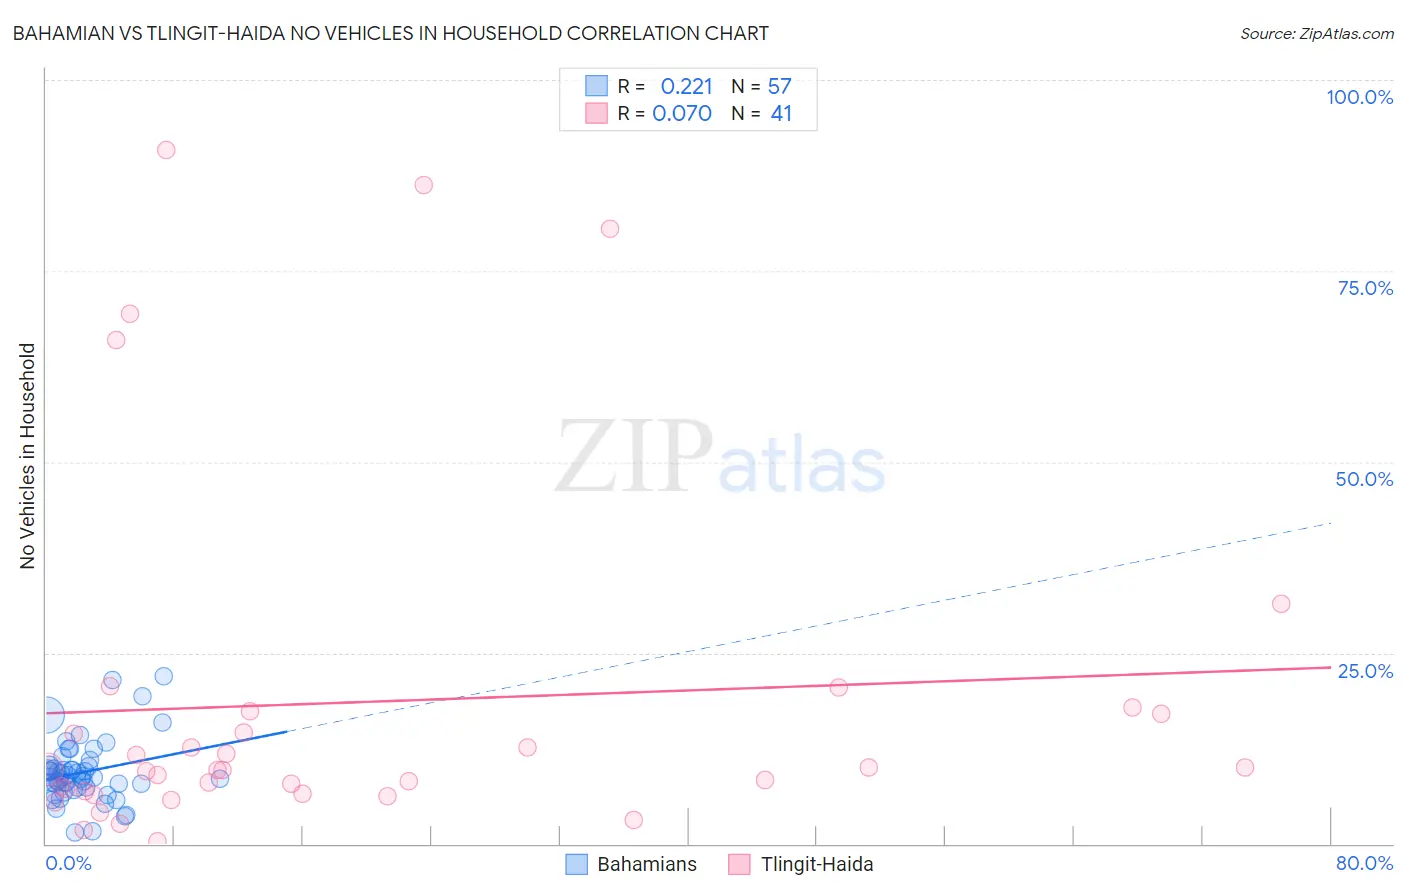
Bahamian vs Tlingit-Haida No Vehicles in Household Correlation Chart
The statistical analysis conducted on geographies consisting of 112,549,845 people shows a weak positive correlation between the proportion of Bahamians and percentage of households with no vehicle available in the United States with a correlation coefficient (R) of 0.221 and weighted average of 9.9%. Similarly, the statistical analysis conducted on geographies consisting of 60,779,226 people shows a slight positive correlation between the proportion of Tlingit-Haida and percentage of households with no vehicle available in the United States with a correlation coefficient (R) of 0.070 and weighted average of 10.1%, a difference of 1.7%.
No Vehicles in Household Correlation Summary
| Measurement | Bahamian | Tlingit-Haida |
| Minimum | 1.4% | 0.39% |
| Maximum | 21.9% | 90.9% |
| Range | 20.5% | 90.5% |
| Mean | 9.3% | 18.5% |
| Median | 8.7% | 9.7% |
| Interquartile 25% (IQ1) | 7.3% | 6.7% |
| Interquartile 75% (IQ3) | 10.2% | 17.2% |
| Interquartile Range (IQR) | 2.9% | 10.4% |
| Standard Deviation (Sample) | 4.1% | 23.6% |
| Standard Deviation (Population) | 4.0% | 23.4% |
Demographics Similar to Bahamians and Tlingit-Haida by No Vehicles in Household
In terms of no vehicles in household, the demographic groups most similar to Bahamians are Chilean (9.9%, a difference of 0.030%), Immigrants from Bahamas (9.9%, a difference of 0.030%), Hungarian (9.9%, a difference of 0.23%), Immigrants from Nicaragua (9.9%, a difference of 0.28%), and Immigrants from Zimbabwe (9.9%, a difference of 0.38%). Similarly, the demographic groups most similar to Tlingit-Haida are Sioux (10.1%, a difference of 0.020%), Salvadoran (10.1%, a difference of 0.030%), Immigrants from Congo (10.1%, a difference of 0.090%), Immigrants from Eastern Africa (10.0%, a difference of 0.23%), and Colombian (10.0%, a difference of 0.24%).
| Demographics | Rating | Rank | No Vehicles in Household |
| Marshallese | 84.0 /100 | #139 | Excellent 9.8% |
| Immigrants | Lithuania | 84.0 /100 | #140 | Excellent 9.8% |
| Sudanese | 83.1 /100 | #141 | Excellent 9.8% |
| Immigrants | Zimbabwe | 82.6 /100 | #142 | Excellent 9.9% |
| Chileans | 81.2 /100 | #143 | Excellent 9.9% |
| Immigrants | Bahamas | 81.2 /100 | #144 | Excellent 9.9% |
| Bahamians | 81.0 /100 | #145 | Excellent 9.9% |
| Hungarians | 80.0 /100 | #146 | Excellent 9.9% |
| Immigrants | Nicaragua | 79.8 /100 | #147 | Good 9.9% |
| Immigrants | Bosnia and Herzegovina | 79.1 /100 | #148 | Good 9.9% |
| Immigrants | Uganda | 76.1 /100 | #149 | Good 10.0% |
| Colombians | 73.9 /100 | #150 | Good 10.0% |
| Immigrants | Eastern Africa | 73.8 /100 | #151 | Good 10.0% |
| Immigrants | Congo | 73.0 /100 | #152 | Good 10.1% |
| Tlingit-Haida | 72.5 /100 | #153 | Good 10.1% |
| Sioux | 72.4 /100 | #154 | Good 10.1% |
| Salvadorans | 72.4 /100 | #155 | Good 10.1% |
| Immigrants | Micronesia | 70.9 /100 | #156 | Good 10.1% |
| Australians | 70.6 /100 | #157 | Good 10.1% |
| Spanish American Indians | 70.2 /100 | #158 | Good 10.1% |
| Immigrants | Indonesia | 69.3 /100 | #159 | Good 10.1% |