Belizean vs Tlingit-Haida No Vehicles in Household
COMPARE
Belizean
Tlingit-Haida
No Vehicles in Household
No Vehicles in Household Comparison
Belizeans
Tlingit-Haida
14.3%
NO VEHICLES IN HOUSEHOLD
0.0/ 100
METRIC RATING
294th/ 347
METRIC RANK
10.1%
NO VEHICLES IN HOUSEHOLD
72.5/ 100
METRIC RATING
153rd/ 347
METRIC RANK
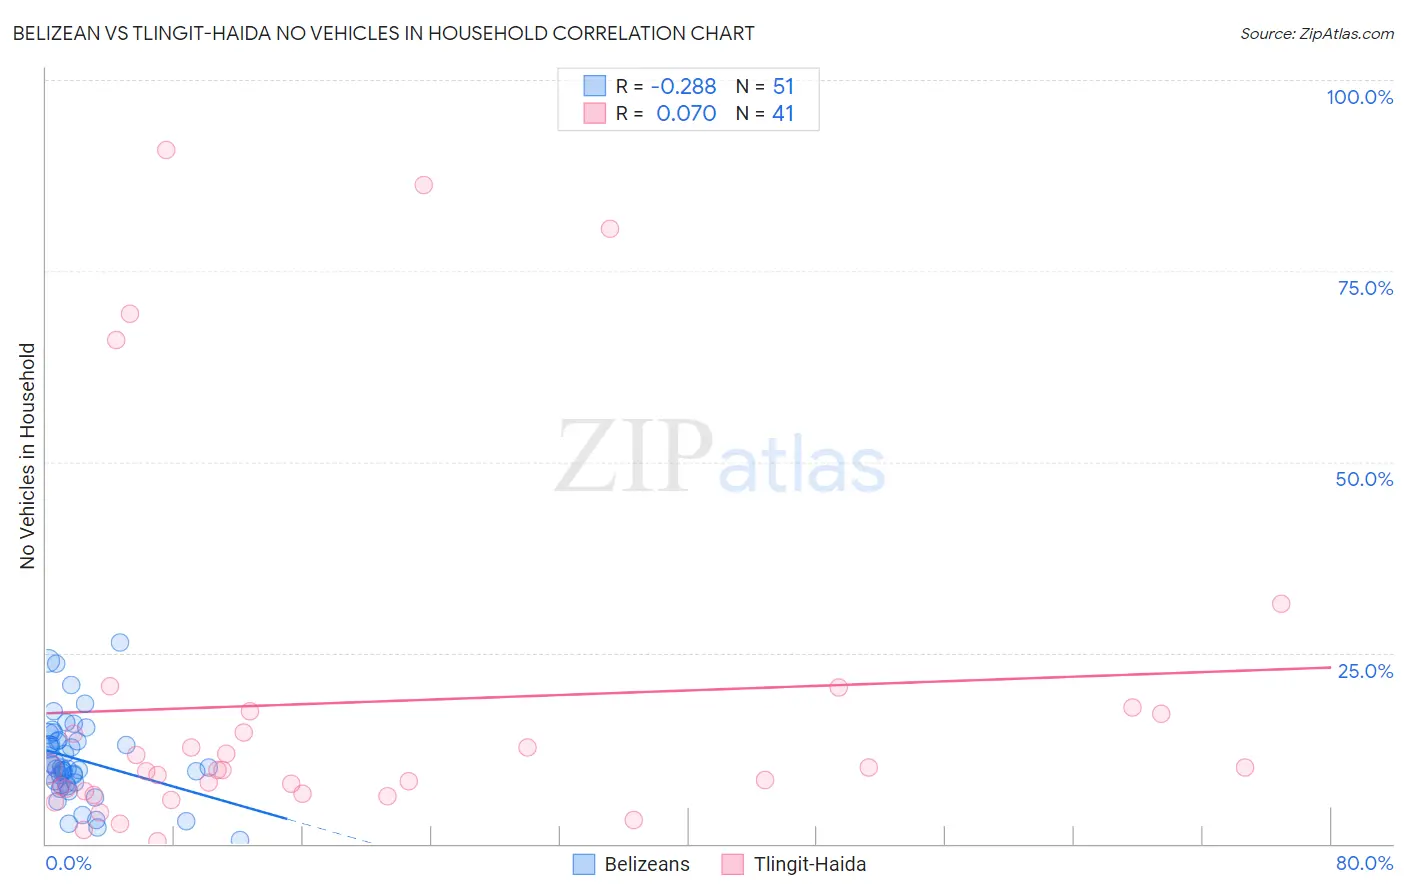
Belizean vs Tlingit-Haida No Vehicles in Household Correlation Chart
The statistical analysis conducted on geographies consisting of 144,103,913 people shows a weak negative correlation between the proportion of Belizeans and percentage of households with no vehicle available in the United States with a correlation coefficient (R) of -0.288 and weighted average of 14.3%. Similarly, the statistical analysis conducted on geographies consisting of 60,779,226 people shows a slight positive correlation between the proportion of Tlingit-Haida and percentage of households with no vehicle available in the United States with a correlation coefficient (R) of 0.070 and weighted average of 10.1%, a difference of 42.5%.
No Vehicles in Household Correlation Summary
| Measurement | Belizean | Tlingit-Haida |
| Minimum | 0.48% | 0.39% |
| Maximum | 26.4% | 90.9% |
| Range | 25.9% | 90.5% |
| Mean | 11.0% | 18.5% |
| Median | 10.0% | 9.7% |
| Interquartile 25% (IQ1) | 7.9% | 6.7% |
| Interquartile 75% (IQ3) | 13.5% | 17.2% |
| Interquartile Range (IQR) | 5.6% | 10.4% |
| Standard Deviation (Sample) | 5.5% | 23.6% |
| Standard Deviation (Population) | 5.4% | 23.4% |
Similar Demographics by No Vehicles in Household
Demographics Similar to Belizeans by No Vehicles in Household
In terms of no vehicles in household, the demographic groups most similar to Belizeans are Paraguayan (14.4%, a difference of 0.13%), Immigrants from Jamaica (14.2%, a difference of 0.78%), Pima (14.1%, a difference of 1.5%), Immigrants from Spain (14.5%, a difference of 1.5%), and Indian (Asian) (14.1%, a difference of 1.9%).
| Demographics | Rating | Rank | No Vehicles in Household |
| Immigrants | Ireland | 0.0 /100 | #287 | Tragic 13.7% |
| Hopi | 0.0 /100 | #288 | Tragic 13.7% |
| Immigrants | Australia | 0.0 /100 | #289 | Tragic 13.8% |
| Indians (Asian) | 0.0 /100 | #290 | Tragic 14.1% |
| Okinawans | 0.0 /100 | #291 | Tragic 14.1% |
| Pima | 0.0 /100 | #292 | Tragic 14.1% |
| Immigrants | Jamaica | 0.0 /100 | #293 | Tragic 14.2% |
| Belizeans | 0.0 /100 | #294 | Tragic 14.3% |
| Paraguayans | 0.0 /100 | #295 | Tragic 14.4% |
| Immigrants | Spain | 0.0 /100 | #296 | Tragic 14.5% |
| Immigrants | Panama | 0.0 /100 | #297 | Tragic 14.6% |
| Moroccans | 0.0 /100 | #298 | Tragic 14.7% |
| Immigrants | Greece | 0.0 /100 | #299 | Tragic 14.7% |
| Yuman | 0.0 /100 | #300 | Tragic 14.9% |
| Immigrants | Ukraine | 0.0 /100 | #301 | Tragic 14.9% |
Demographics Similar to Tlingit-Haida by No Vehicles in Household
In terms of no vehicles in household, the demographic groups most similar to Tlingit-Haida are Sioux (10.1%, a difference of 0.020%), Salvadoran (10.1%, a difference of 0.030%), Immigrants from Congo (10.1%, a difference of 0.090%), Immigrants from Eastern Africa (10.0%, a difference of 0.23%), and Colombian (10.0%, a difference of 0.24%).
| Demographics | Rating | Rank | No Vehicles in Household |
| Hungarians | 80.0 /100 | #146 | Excellent 9.9% |
| Immigrants | Nicaragua | 79.8 /100 | #147 | Good 9.9% |
| Immigrants | Bosnia and Herzegovina | 79.1 /100 | #148 | Good 9.9% |
| Immigrants | Uganda | 76.1 /100 | #149 | Good 10.0% |
| Colombians | 73.9 /100 | #150 | Good 10.0% |
| Immigrants | Eastern Africa | 73.8 /100 | #151 | Good 10.0% |
| Immigrants | Congo | 73.0 /100 | #152 | Good 10.1% |
| Tlingit-Haida | 72.5 /100 | #153 | Good 10.1% |
| Sioux | 72.4 /100 | #154 | Good 10.1% |
| Salvadorans | 72.4 /100 | #155 | Good 10.1% |
| Immigrants | Micronesia | 70.9 /100 | #156 | Good 10.1% |
| Australians | 70.6 /100 | #157 | Good 10.1% |
| Spanish American Indians | 70.2 /100 | #158 | Good 10.1% |
| Immigrants | Indonesia | 69.3 /100 | #159 | Good 10.1% |
| Immigrants | Middle Africa | 65.7 /100 | #160 | Good 10.2% |