Jordanian vs Tlingit-Haida No Vehicles in Household
COMPARE
Jordanian
Tlingit-Haida
No Vehicles in Household
No Vehicles in Household Comparison
Jordanians
Tlingit-Haida
8.5%
NO VEHICLES IN HOUSEHOLD
99.5/ 100
METRIC RATING
75th/ 347
METRIC RANK
10.1%
NO VEHICLES IN HOUSEHOLD
72.5/ 100
METRIC RATING
153rd/ 347
METRIC RANK
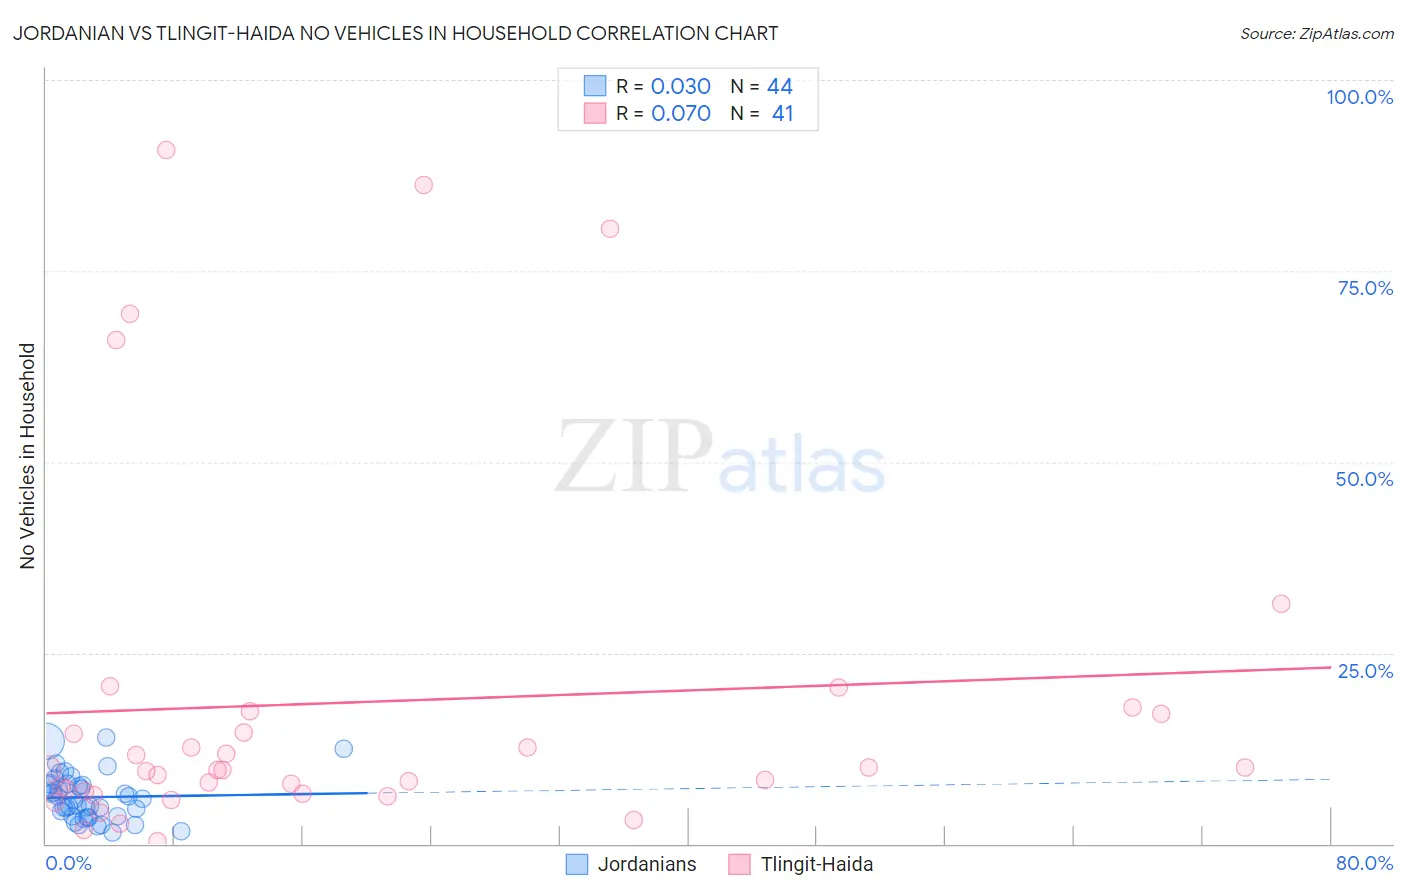
Jordanian vs Tlingit-Haida No Vehicles in Household Correlation Chart
The statistical analysis conducted on geographies consisting of 166,331,482 people shows no correlation between the proportion of Jordanians and percentage of households with no vehicle available in the United States with a correlation coefficient (R) of 0.030 and weighted average of 8.5%. Similarly, the statistical analysis conducted on geographies consisting of 60,779,226 people shows a slight positive correlation between the proportion of Tlingit-Haida and percentage of households with no vehicle available in the United States with a correlation coefficient (R) of 0.070 and weighted average of 10.1%, a difference of 18.0%.
No Vehicles in Household Correlation Summary
| Measurement | Jordanian | Tlingit-Haida |
| Minimum | 1.4% | 0.39% |
| Maximum | 13.9% | 90.9% |
| Range | 12.5% | 90.5% |
| Mean | 6.1% | 18.5% |
| Median | 5.8% | 9.7% |
| Interquartile 25% (IQ1) | 3.6% | 6.7% |
| Interquartile 75% (IQ3) | 7.8% | 17.2% |
| Interquartile Range (IQR) | 4.2% | 10.4% |
| Standard Deviation (Sample) | 3.1% | 23.6% |
| Standard Deviation (Population) | 3.0% | 23.4% |
Similar Demographics by No Vehicles in Household
Demographics Similar to Jordanians by No Vehicles in Household
In terms of no vehicles in household, the demographic groups most similar to Jordanians are Cuban (8.5%, a difference of 0.22%), Immigrants from Philippines (8.5%, a difference of 0.24%), Iranian (8.6%, a difference of 0.33%), Immigrants from South Central Asia (8.6%, a difference of 0.45%), and Portuguese (8.6%, a difference of 0.51%).
| Demographics | Rating | Rank | No Vehicles in Household |
| Immigrants | Iran | 99.7 /100 | #68 | Exceptional 8.4% |
| Spaniards | 99.7 /100 | #69 | Exceptional 8.4% |
| Cajuns | 99.6 /100 | #70 | Exceptional 8.4% |
| Immigrants | Lebanon | 99.6 /100 | #71 | Exceptional 8.4% |
| Lithuanians | 99.6 /100 | #72 | Exceptional 8.4% |
| Poles | 99.6 /100 | #73 | Exceptional 8.4% |
| Cubans | 99.5 /100 | #74 | Exceptional 8.5% |
| Jordanians | 99.5 /100 | #75 | Exceptional 8.5% |
| Immigrants | Philippines | 99.5 /100 | #76 | Exceptional 8.5% |
| Iranians | 99.5 /100 | #77 | Exceptional 8.6% |
| Immigrants | South Central Asia | 99.5 /100 | #78 | Exceptional 8.6% |
| Portuguese | 99.5 /100 | #79 | Exceptional 8.6% |
| Bolivians | 99.4 /100 | #80 | Exceptional 8.6% |
| Tsimshian | 99.4 /100 | #81 | Exceptional 8.6% |
| Immigrants | South Eastern Asia | 99.4 /100 | #82 | Exceptional 8.6% |
Demographics Similar to Tlingit-Haida by No Vehicles in Household
In terms of no vehicles in household, the demographic groups most similar to Tlingit-Haida are Sioux (10.1%, a difference of 0.020%), Salvadoran (10.1%, a difference of 0.030%), Immigrants from Congo (10.1%, a difference of 0.090%), Immigrants from Eastern Africa (10.0%, a difference of 0.23%), and Colombian (10.0%, a difference of 0.24%).
| Demographics | Rating | Rank | No Vehicles in Household |
| Hungarians | 80.0 /100 | #146 | Excellent 9.9% |
| Immigrants | Nicaragua | 79.8 /100 | #147 | Good 9.9% |
| Immigrants | Bosnia and Herzegovina | 79.1 /100 | #148 | Good 9.9% |
| Immigrants | Uganda | 76.1 /100 | #149 | Good 10.0% |
| Colombians | 73.9 /100 | #150 | Good 10.0% |
| Immigrants | Eastern Africa | 73.8 /100 | #151 | Good 10.0% |
| Immigrants | Congo | 73.0 /100 | #152 | Good 10.1% |
| Tlingit-Haida | 72.5 /100 | #153 | Good 10.1% |
| Sioux | 72.4 /100 | #154 | Good 10.1% |
| Salvadorans | 72.4 /100 | #155 | Good 10.1% |
| Immigrants | Micronesia | 70.9 /100 | #156 | Good 10.1% |
| Australians | 70.6 /100 | #157 | Good 10.1% |
| Spanish American Indians | 70.2 /100 | #158 | Good 10.1% |
| Immigrants | Indonesia | 69.3 /100 | #159 | Good 10.1% |
| Immigrants | Middle Africa | 65.7 /100 | #160 | Good 10.2% |