Immigrants from Senegal vs Native/Alaskan No Vehicles in Household
COMPARE
Immigrants from Senegal
Native/Alaskan
No Vehicles in Household
No Vehicles in Household Comparison
Immigrants from Senegal
Natives/Alaskans
21.1%
NO VEHICLES IN HOUSEHOLD
0.0/ 100
METRIC RATING
327th/ 347
METRIC RANK
10.5%
NO VEHICLES IN HOUSEHOLD
43.7/ 100
METRIC RATING
183rd/ 347
METRIC RANK
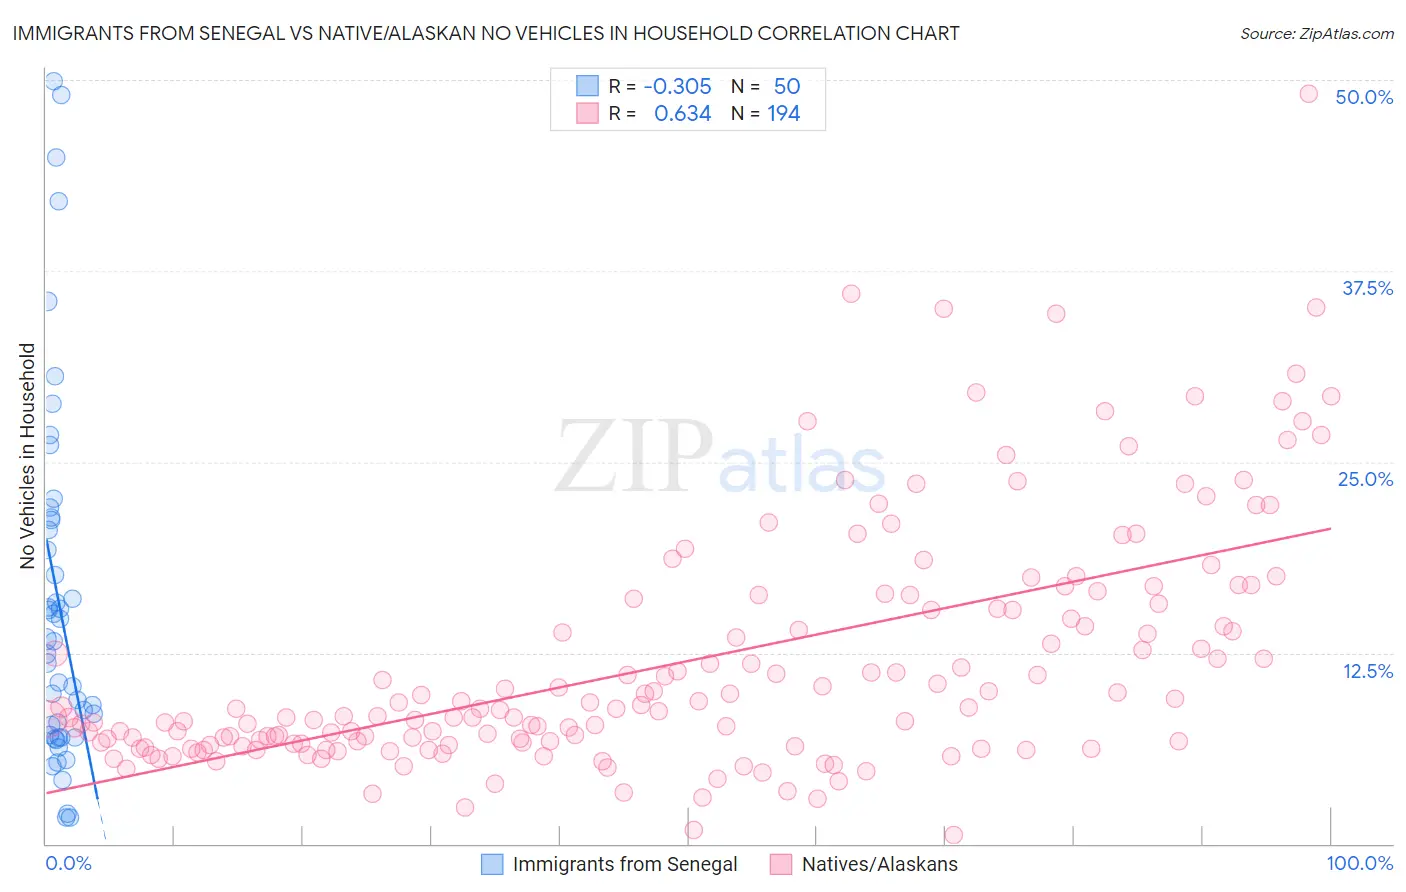
Immigrants from Senegal vs Native/Alaskan No Vehicles in Household Correlation Chart
The statistical analysis conducted on geographies consisting of 90,082,308 people shows a mild negative correlation between the proportion of Immigrants from Senegal and percentage of households with no vehicle available in the United States with a correlation coefficient (R) of -0.305 and weighted average of 21.1%. Similarly, the statistical analysis conducted on geographies consisting of 510,438,252 people shows a significant positive correlation between the proportion of Natives/Alaskans and percentage of households with no vehicle available in the United States with a correlation coefficient (R) of 0.634 and weighted average of 10.5%, a difference of 101.5%.
No Vehicles in Household Correlation Summary
| Measurement | Immigrants from Senegal | Native/Alaskan |
| Minimum | 1.7% | 0.55% |
| Maximum | 49.9% | 49.1% |
| Range | 48.2% | 48.5% |
| Mean | 15.8% | 11.9% |
| Median | 12.8% | 8.8% |
| Interquartile 25% (IQ1) | 7.0% | 6.6% |
| Interquartile 75% (IQ3) | 21.2% | 15.3% |
| Interquartile Range (IQR) | 14.2% | 8.8% |
| Standard Deviation (Sample) | 12.0% | 7.9% |
| Standard Deviation (Population) | 11.9% | 7.9% |
Similar Demographics by No Vehicles in Household
Demographics Similar to Immigrants from Senegal by No Vehicles in Household
In terms of no vehicles in household, the demographic groups most similar to Immigrants from Senegal are Immigrants from West Indies (20.5%, a difference of 3.0%), Immigrants from Dominica (22.2%, a difference of 5.1%), Senegalese (19.8%, a difference of 7.0%), Ecuadorian (22.8%, a difference of 7.6%), and Immigrants from Caribbean (19.6%, a difference of 7.8%).
| Demographics | Rating | Rank | No Vehicles in Household |
| Soviet Union | 0.0 /100 | #320 | Tragic 17.4% |
| Jamaicans | 0.0 /100 | #321 | Tragic 17.9% |
| Immigrants | Cabo Verde | 0.0 /100 | #322 | Tragic 18.4% |
| Immigrants | Yemen | 0.0 /100 | #323 | Tragic 19.5% |
| Immigrants | Caribbean | 0.0 /100 | #324 | Tragic 19.6% |
| Senegalese | 0.0 /100 | #325 | Tragic 19.8% |
| Immigrants | West Indies | 0.0 /100 | #326 | Tragic 20.5% |
| Immigrants | Senegal | 0.0 /100 | #327 | Tragic 21.1% |
| Immigrants | Dominica | 0.0 /100 | #328 | Tragic 22.2% |
| Ecuadorians | 0.0 /100 | #329 | Tragic 22.8% |
| West Indians | 0.0 /100 | #330 | Tragic 23.7% |
| Trinidadians and Tobagonians | 0.0 /100 | #331 | Tragic 23.7% |
| Immigrants | Ecuador | 0.0 /100 | #332 | Tragic 23.8% |
| Immigrants | Trinidad and Tobago | 0.0 /100 | #333 | Tragic 24.6% |
| Immigrants | Bangladesh | 0.0 /100 | #334 | Tragic 25.8% |
Demographics Similar to Natives/Alaskans by No Vehicles in Household
In terms of no vehicles in household, the demographic groups most similar to Natives/Alaskans are Immigrants from Bulgaria (10.5%, a difference of 0.020%), Immigrants from Colombia (10.5%, a difference of 0.060%), Immigrants from Nepal (10.5%, a difference of 0.17%), Arab (10.5%, a difference of 0.22%), and South American (10.5%, a difference of 0.24%).
| Demographics | Rating | Rank | No Vehicles in Household |
| French American Indians | 49.1 /100 | #176 | Average 10.4% |
| Immigrants | El Salvador | 49.1 /100 | #177 | Average 10.4% |
| Immigrants | Ethiopia | 48.0 /100 | #178 | Average 10.4% |
| Ethiopians | 45.8 /100 | #179 | Average 10.5% |
| Arabs | 45.3 /100 | #180 | Average 10.5% |
| Immigrants | Colombia | 44.1 /100 | #181 | Average 10.5% |
| Immigrants | Bulgaria | 43.8 /100 | #182 | Average 10.5% |
| Natives/Alaskans | 43.7 /100 | #183 | Average 10.5% |
| Immigrants | Nepal | 42.4 /100 | #184 | Average 10.5% |
| South Americans | 41.9 /100 | #185 | Average 10.5% |
| German Russians | 40.6 /100 | #186 | Average 10.5% |
| Immigrants | Poland | 38.4 /100 | #187 | Fair 10.6% |
| Immigrants | Armenia | 37.5 /100 | #188 | Fair 10.6% |
| Immigrants | Eritrea | 36.3 /100 | #189 | Fair 10.6% |
| Immigrants | North Macedonia | 34.6 /100 | #190 | Fair 10.6% |