Apache vs Croatian In Labor Force | Age 20-24
COMPARE
Apache
Croatian
In Labor Force | Age 20-24
In Labor Force | Age 20-24 Comparison
Apache
Croatians
72.0%
IN LABOR FORCE | AGE 20-24
0.0/ 100
METRIC RATING
311th/ 347
METRIC RANK
77.2%
IN LABOR FORCE | AGE 20-24
100.0/ 100
METRIC RATING
51st/ 347
METRIC RANK
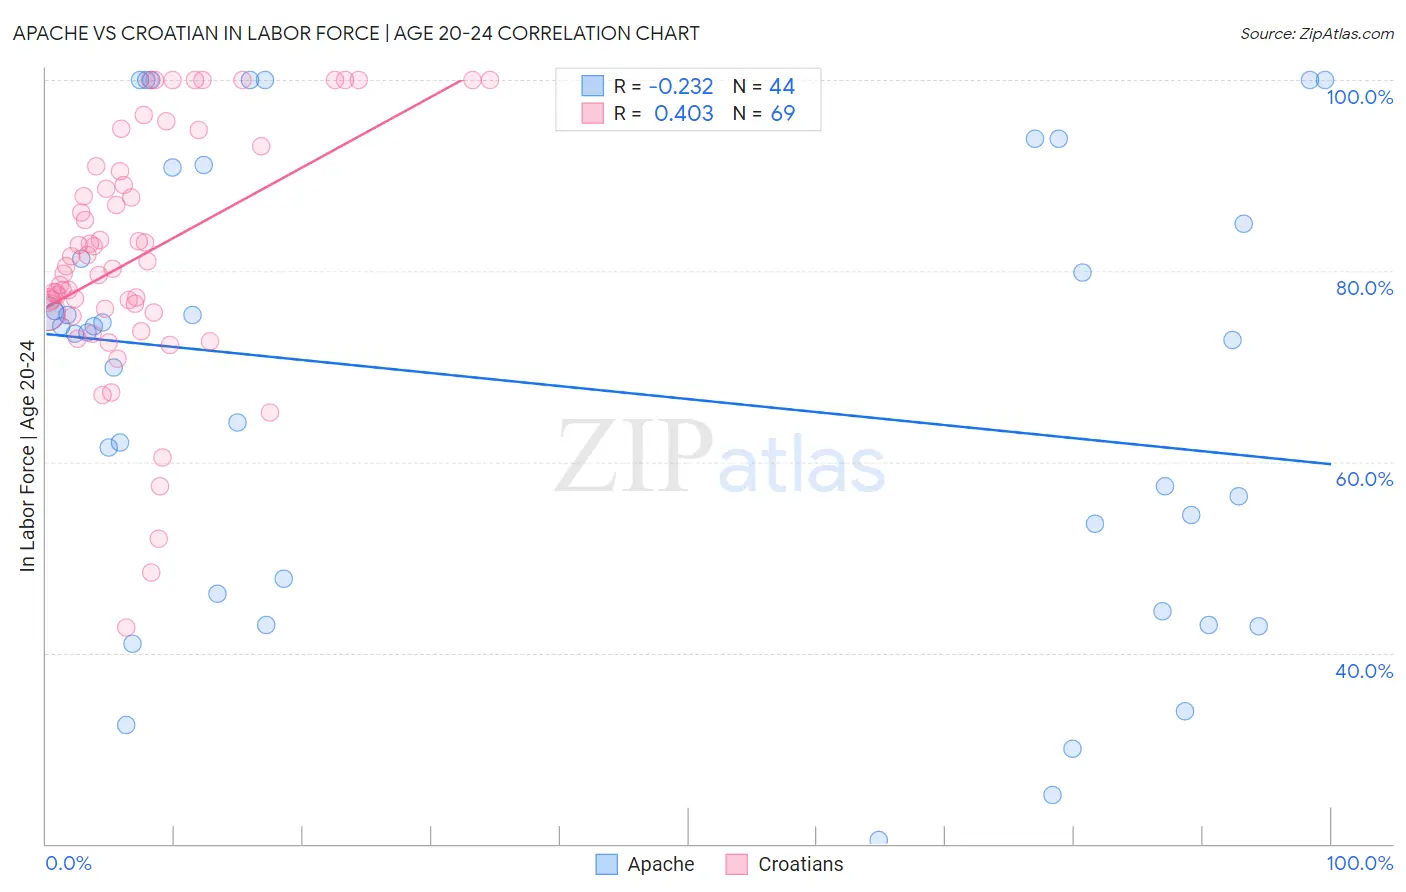
Apache vs Croatian In Labor Force | Age 20-24 Correlation Chart
The statistical analysis conducted on geographies consisting of 231,058,831 people shows a weak negative correlation between the proportion of Apache and labor force participation rate among population between the ages 20 and 24 in the United States with a correlation coefficient (R) of -0.232 and weighted average of 72.0%. Similarly, the statistical analysis conducted on geographies consisting of 375,516,771 people shows a moderate positive correlation between the proportion of Croatians and labor force participation rate among population between the ages 20 and 24 in the United States with a correlation coefficient (R) of 0.403 and weighted average of 77.2%, a difference of 7.3%.
In Labor Force | Age 20-24 Correlation Summary
| Measurement | Apache | Croatian |
| Minimum | 20.4% | 42.6% |
| Maximum | 100.0% | 100.0% |
| Range | 79.6% | 57.4% |
| Mean | 67.9% | 81.6% |
| Median | 73.5% | 80.5% |
| Interquartile 25% (IQ1) | 47.0% | 75.7% |
| Interquartile 75% (IQ3) | 87.9% | 90.7% |
| Interquartile Range (IQR) | 40.9% | 15.1% |
| Standard Deviation (Sample) | 23.3% | 12.8% |
| Standard Deviation (Population) | 23.1% | 12.7% |
Similar Demographics by In Labor Force | Age 20-24
Demographics Similar to Apache by In Labor Force | Age 20-24
In terms of in labor force | age 20-24, the demographic groups most similar to Apache are Immigrants from Cuba (72.0%, a difference of 0.010%), Immigrants from Caribbean (71.9%, a difference of 0.070%), Immigrants from Dominica (71.9%, a difference of 0.12%), Indian (Asian) (71.9%, a difference of 0.13%), and Immigrants from Iran (71.8%, a difference of 0.22%).
| Demographics | Rating | Rank | In Labor Force | Age 20-24 |
| Immigrants | West Indies | 0.0 /100 | #304 | Tragic 72.4% |
| Immigrants | Singapore | 0.0 /100 | #305 | Tragic 72.4% |
| Immigrants | Jamaica | 0.0 /100 | #306 | Tragic 72.4% |
| Immigrants | Ecuador | 0.0 /100 | #307 | Tragic 72.3% |
| Soviet Union | 0.0 /100 | #308 | Tragic 72.3% |
| Tsimshian | 0.0 /100 | #309 | Tragic 72.3% |
| Immigrants | Cuba | 0.0 /100 | #310 | Tragic 72.0% |
| Apache | 0.0 /100 | #311 | Tragic 72.0% |
| Immigrants | Caribbean | 0.0 /100 | #312 | Tragic 71.9% |
| Immigrants | Dominica | 0.0 /100 | #313 | Tragic 71.9% |
| Indians (Asian) | 0.0 /100 | #314 | Tragic 71.9% |
| Immigrants | Iran | 0.0 /100 | #315 | Tragic 71.8% |
| Immigrants | Eastern Asia | 0.0 /100 | #316 | Tragic 71.8% |
| Immigrants | Armenia | 0.0 /100 | #317 | Tragic 71.7% |
| Immigrants | Hong Kong | 0.0 /100 | #318 | Tragic 71.6% |
Demographics Similar to Croatians by In Labor Force | Age 20-24
In terms of in labor force | age 20-24, the demographic groups most similar to Croatians are Malaysian (77.2%, a difference of 0.010%), Indonesian (77.2%, a difference of 0.010%), Immigrants from the Azores (77.2%, a difference of 0.020%), Chinese (77.3%, a difference of 0.050%), and Serbian (77.3%, a difference of 0.060%).
| Demographics | Rating | Rank | In Labor Force | Age 20-24 |
| Fijians | 100.0 /100 | #44 | Exceptional 77.4% |
| Native Hawaiians | 100.0 /100 | #45 | Exceptional 77.4% |
| Samoans | 100.0 /100 | #46 | Exceptional 77.4% |
| Ethiopians | 100.0 /100 | #47 | Exceptional 77.3% |
| Serbians | 100.0 /100 | #48 | Exceptional 77.3% |
| Chinese | 100.0 /100 | #49 | Exceptional 77.3% |
| Malaysians | 100.0 /100 | #50 | Exceptional 77.2% |
| Croatians | 100.0 /100 | #51 | Exceptional 77.2% |
| Indonesians | 100.0 /100 | #52 | Exceptional 77.2% |
| Immigrants | Azores | 100.0 /100 | #53 | Exceptional 77.2% |
| Celtics | 99.9 /100 | #54 | Exceptional 77.1% |
| Immigrants | Liberia | 99.9 /100 | #55 | Exceptional 77.1% |
| Europeans | 99.9 /100 | #56 | Exceptional 77.1% |
| Chippewa | 99.9 /100 | #57 | Exceptional 77.1% |
| Hawaiians | 99.9 /100 | #58 | Exceptional 77.0% |