American vs Chilean 2 or more Vehicles in Household
COMPARE
American
Chilean
2 or more Vehicles in Household
2 or more Vehicles in Household Comparison
Americans
Chileans
60.0%
2 OR MORE VEHICLES IN HOUSEHOLD
100.0/ 100
METRIC RATING
38th/ 347
METRIC RANK
56.1%
2 OR MORE VEHICLES IN HOUSEHOLD
80.2/ 100
METRIC RATING
149th/ 347
METRIC RANK
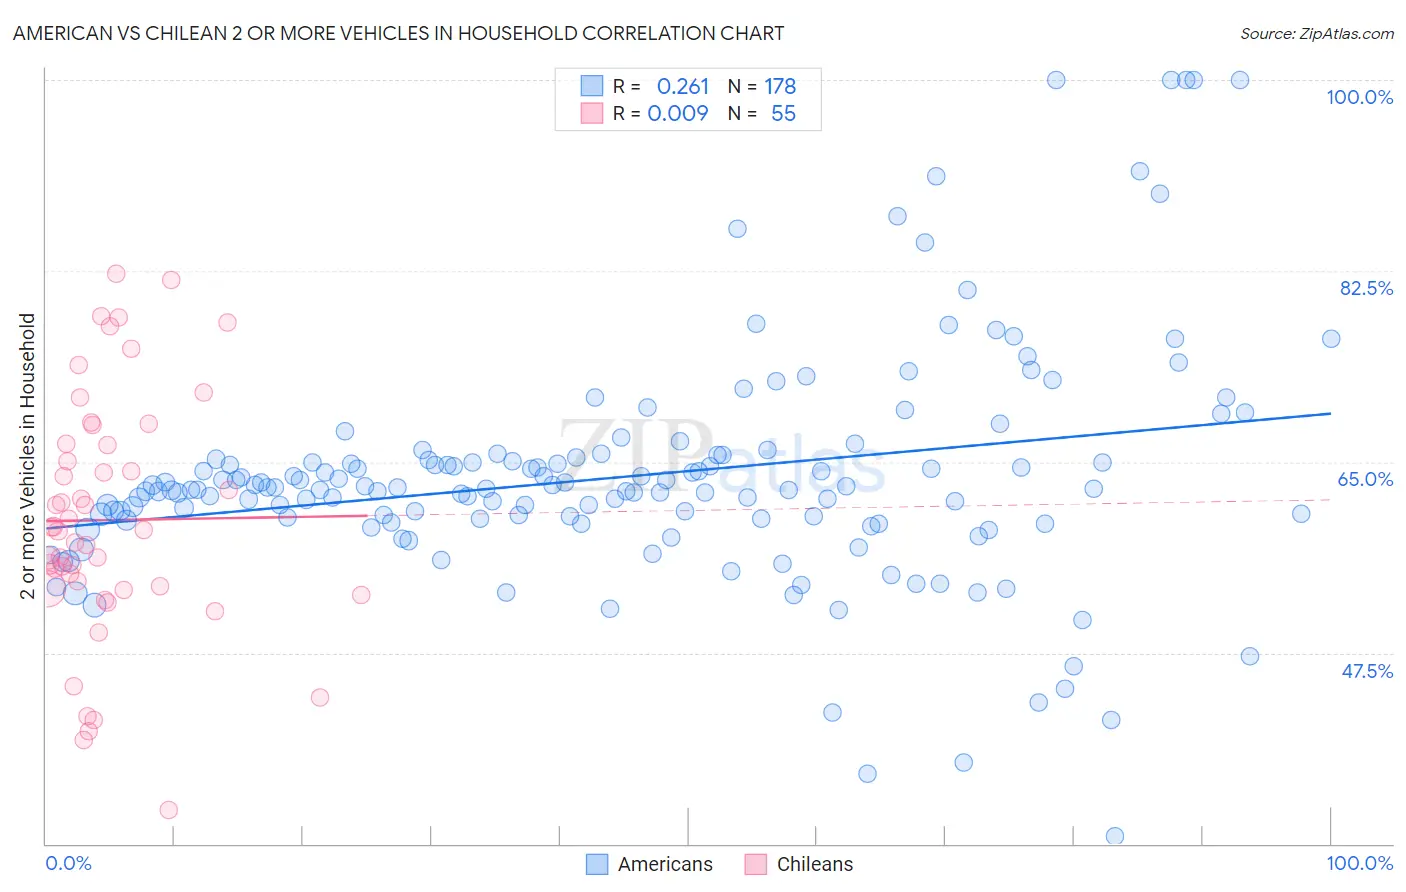
American vs Chilean 2 or more Vehicles in Household Correlation Chart
The statistical analysis conducted on geographies consisting of 581,432,617 people shows a weak positive correlation between the proportion of Americans and percentage of households with 2 or more vehicles available in the United States with a correlation coefficient (R) of 0.261 and weighted average of 60.0%. Similarly, the statistical analysis conducted on geographies consisting of 256,591,468 people shows no correlation between the proportion of Chileans and percentage of households with 2 or more vehicles available in the United States with a correlation coefficient (R) of 0.009 and weighted average of 56.1%, a difference of 7.0%.
2 or more Vehicles in Household Correlation Summary
| Measurement | American | Chilean |
| Minimum | 30.7% | 33.1% |
| Maximum | 100.0% | 82.2% |
| Range | 69.3% | 49.1% |
| Mean | 63.6% | 59.7% |
| Median | 62.5% | 58.8% |
| Interquartile 25% (IQ1) | 59.7% | 53.3% |
| Interquartile 75% (IQ3) | 65.2% | 66.7% |
| Interquartile Range (IQR) | 5.6% | 13.4% |
| Standard Deviation (Sample) | 10.7% | 11.2% |
| Standard Deviation (Population) | 10.7% | 11.1% |
Similar Demographics by 2 or more Vehicles in Household
Demographics Similar to Americans by 2 or more Vehicles in Household
In terms of 2 or more vehicles in household, the demographic groups most similar to Americans are British (60.0%, a difference of 0.0%), Irish (60.1%, a difference of 0.060%), Chinese (60.1%, a difference of 0.10%), Immigrants from Philippines (60.1%, a difference of 0.12%), and Spanish (60.2%, a difference of 0.24%).
| Demographics | Rating | Rank | 2 or more Vehicles in Household |
| Spanish American Indians | 100.0 /100 | #31 | Exceptional 60.3% |
| Arapaho | 100.0 /100 | #32 | Exceptional 60.2% |
| Immigrants | Mexico | 100.0 /100 | #33 | Exceptional 60.2% |
| Spanish | 100.0 /100 | #34 | Exceptional 60.2% |
| Immigrants | Philippines | 100.0 /100 | #35 | Exceptional 60.1% |
| Chinese | 100.0 /100 | #36 | Exceptional 60.1% |
| Irish | 100.0 /100 | #37 | Exceptional 60.1% |
| Americans | 100.0 /100 | #38 | Exceptional 60.0% |
| British | 100.0 /100 | #39 | Exceptional 60.0% |
| Cherokee | 100.0 /100 | #40 | Exceptional 59.9% |
| Northern Europeans | 100.0 /100 | #41 | Exceptional 59.9% |
| Malaysians | 100.0 /100 | #42 | Exceptional 59.8% |
| Czechoslovakians | 100.0 /100 | #43 | Exceptional 59.8% |
| French | 100.0 /100 | #44 | Exceptional 59.8% |
| Immigrants | Taiwan | 100.0 /100 | #45 | Exceptional 59.7% |
Demographics Similar to Chileans by 2 or more Vehicles in Household
In terms of 2 or more vehicles in household, the demographic groups most similar to Chileans are Immigrants from Moldova (56.1%, a difference of 0.0%), Serbian (56.1%, a difference of 0.010%), Nicaraguan (56.1%, a difference of 0.020%), Venezuelan (56.1%, a difference of 0.030%), and Syrian (56.2%, a difference of 0.060%).
| Demographics | Rating | Rank | 2 or more Vehicles in Household |
| South Africans | 83.1 /100 | #142 | Excellent 56.2% |
| Seminole | 81.7 /100 | #143 | Excellent 56.2% |
| Immigrants | Syria | 81.4 /100 | #144 | Excellent 56.2% |
| Syrians | 81.2 /100 | #145 | Excellent 56.2% |
| Venezuelans | 80.7 /100 | #146 | Excellent 56.1% |
| Serbians | 80.3 /100 | #147 | Excellent 56.1% |
| Immigrants | Moldova | 80.2 /100 | #148 | Excellent 56.1% |
| Chileans | 80.2 /100 | #149 | Excellent 56.1% |
| Nicaraguans | 79.9 /100 | #150 | Good 56.1% |
| Immigrants | Northern Europe | 78.7 /100 | #151 | Good 56.1% |
| Immigrants | Pakistan | 78.1 /100 | #152 | Good 56.1% |
| Lumbee | 71.9 /100 | #153 | Good 55.9% |
| Ukrainians | 70.8 /100 | #154 | Good 55.8% |
| Immigrants | Venezuela | 70.7 /100 | #155 | Good 55.8% |
| Immigrants | Lithuania | 70.4 /100 | #156 | Good 55.8% |