Alaska Native vs Samoan Median Household Income
COMPARE
Alaska Native
Samoan
Median Household Income
Median Household Income Comparison
Alaska Natives
Samoans
$79,509
MEDIAN HOUSEHOLD INCOME
2.7/ 100
METRIC RATING
239th/ 347
METRIC RANK
$86,498
MEDIAN HOUSEHOLD INCOME
71.0/ 100
METRIC RATING
157th/ 347
METRIC RANK
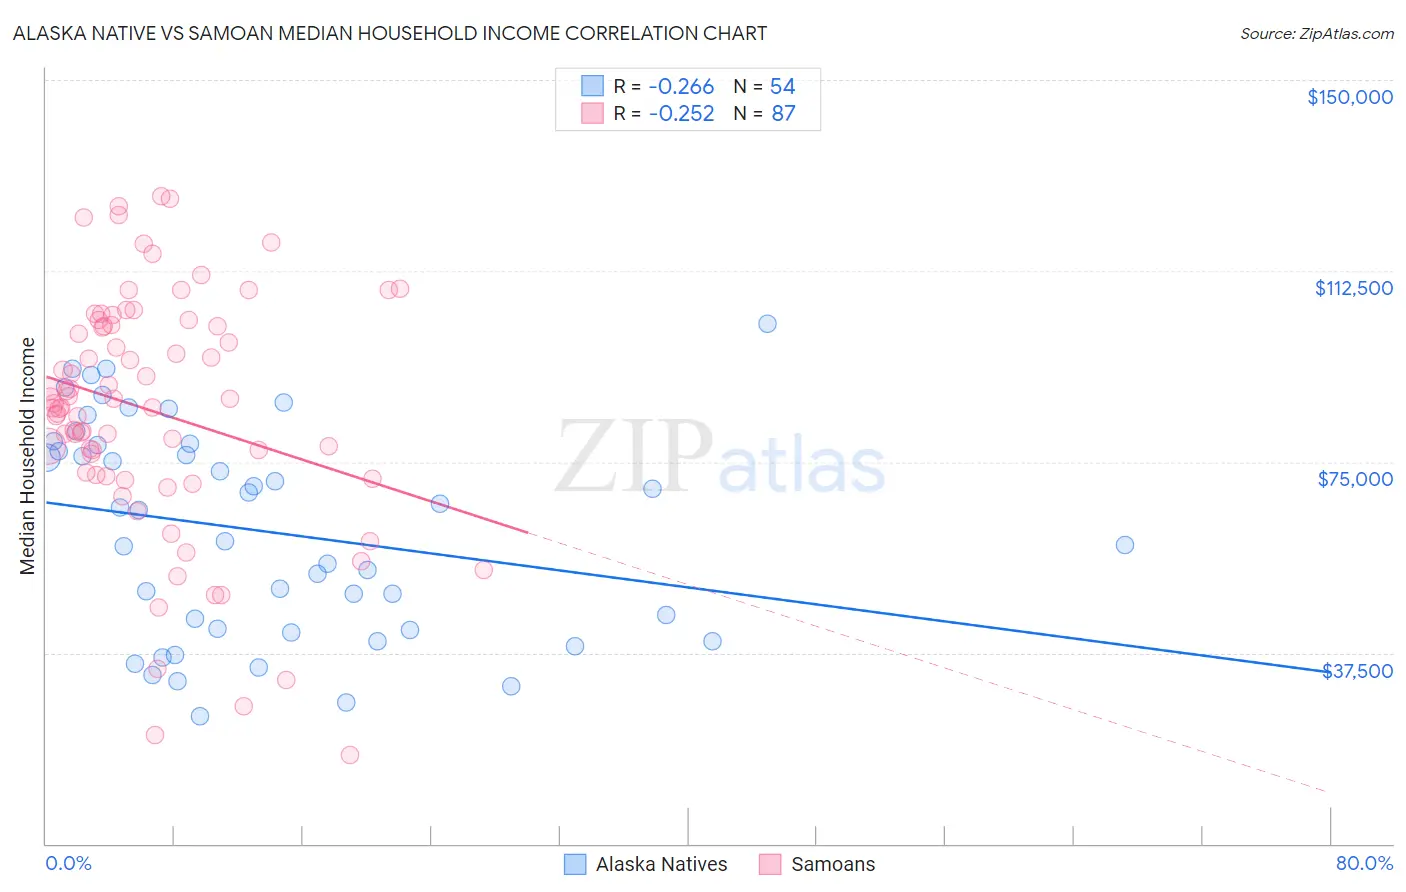
Alaska Native vs Samoan Median Household Income Correlation Chart
The statistical analysis conducted on geographies consisting of 76,748,502 people shows a weak negative correlation between the proportion of Alaska Natives and median household income in the United States with a correlation coefficient (R) of -0.266 and weighted average of $79,509. Similarly, the statistical analysis conducted on geographies consisting of 225,063,012 people shows a weak negative correlation between the proportion of Samoans and median household income in the United States with a correlation coefficient (R) of -0.252 and weighted average of $86,498, a difference of 8.8%.
Median Household Income Correlation Summary
| Measurement | Alaska Native | Samoan |
| Minimum | $25,000 | $17,452 |
| Maximum | $102,083 | $127,143 |
| Range | $77,083 | $109,691 |
| Mean | $61,313 | $84,959 |
| Median | $62,466 | $86,491 |
| Interquartile 25% (IQ1) | $41,964 | $72,428 |
| Interquartile 75% (IQ3) | $78,336 | $101,996 |
| Interquartile Range (IQR) | $36,372 | $29,568 |
| Standard Deviation (Sample) | $20,803 | $23,715 |
| Standard Deviation (Population) | $20,609 | $23,578 |
Similar Demographics by Median Household Income
Demographics Similar to Alaska Natives by Median Household Income
In terms of median household income, the demographic groups most similar to Alaska Natives are Immigrants from Western Africa ($79,490, a difference of 0.020%), Nonimmigrants ($79,429, a difference of 0.10%), Barbadian ($79,664, a difference of 0.20%), Nicaraguan ($79,737, a difference of 0.29%), and Immigrants from Bosnia and Herzegovina ($79,888, a difference of 0.48%).
| Demographics | Rating | Rank | Median Household Income |
| Immigrants | Trinidad and Tobago | 4.6 /100 | #232 | Tragic $80,373 |
| Immigrants | Azores | 4.5 /100 | #233 | Tragic $80,357 |
| Immigrants | Ecuador | 4.5 /100 | #234 | Tragic $80,341 |
| Immigrants | Guyana | 4.5 /100 | #235 | Tragic $80,324 |
| Immigrants | Bosnia and Herzegovina | 3.4 /100 | #236 | Tragic $79,888 |
| Nicaraguans | 3.1 /100 | #237 | Tragic $79,737 |
| Barbadians | 3.0 /100 | #238 | Tragic $79,664 |
| Alaska Natives | 2.7 /100 | #239 | Tragic $79,509 |
| Immigrants | Western Africa | 2.7 /100 | #240 | Tragic $79,490 |
| Immigrants | Nonimmigrants | 2.6 /100 | #241 | Tragic $79,429 |
| Immigrants | Sudan | 2.1 /100 | #242 | Tragic $79,103 |
| Immigrants | Barbados | 1.9 /100 | #243 | Tragic $78,989 |
| Marshallese | 1.9 /100 | #244 | Tragic $78,930 |
| Inupiat | 1.8 /100 | #245 | Tragic $78,841 |
| Central Americans | 1.7 /100 | #246 | Tragic $78,803 |
Demographics Similar to Samoans by Median Household Income
In terms of median household income, the demographic groups most similar to Samoans are Immigrants from Albania ($86,534, a difference of 0.040%), Moroccan ($86,468, a difference of 0.040%), Immigrants from Uzbekistan ($86,425, a difference of 0.080%), Luxembourger ($86,418, a difference of 0.090%), and Slavic ($86,398, a difference of 0.12%).
| Demographics | Rating | Rank | Median Household Income |
| Basques | 77.2 /100 | #150 | Good $87,001 |
| Hungarians | 76.3 /100 | #151 | Good $86,920 |
| Immigrants | Saudi Arabia | 75.8 /100 | #152 | Good $86,875 |
| South Americans | 75.1 /100 | #153 | Good $86,824 |
| Immigrants | Germany | 74.4 /100 | #154 | Good $86,764 |
| Carpatho Rusyns | 72.8 /100 | #155 | Good $86,635 |
| Immigrants | Albania | 71.5 /100 | #156 | Good $86,534 |
| Samoans | 71.0 /100 | #157 | Good $86,498 |
| Moroccans | 70.6 /100 | #158 | Good $86,468 |
| Immigrants | Uzbekistan | 70.1 /100 | #159 | Good $86,425 |
| Luxembourgers | 70.0 /100 | #160 | Good $86,418 |
| Slavs | 69.7 /100 | #161 | Good $86,398 |
| Guamanians/Chamorros | 67.7 /100 | #162 | Good $86,255 |
| Czechs | 66.4 /100 | #163 | Good $86,164 |
| Irish | 66.2 /100 | #164 | Good $86,145 |