Dutch West Indian vs Australian 1 or more Vehicles in Household
COMPARE
Dutch West Indian
Australian
1 or more Vehicles in Household
1 or more Vehicles in Household Comparison
Dutch West Indians
Australians
89.0%
1 OR MORE VEHICLES IN HOUSEHOLD
13.5/ 100
METRIC RATING
210th/ 347
METRIC RANK
90.0%
1 OR MORE VEHICLES IN HOUSEHOLD
72.4/ 100
METRIC RATING
156th/ 347
METRIC RANK
Dutch West Indian vs Australian 1 or more Vehicles in Household Correlation Chart
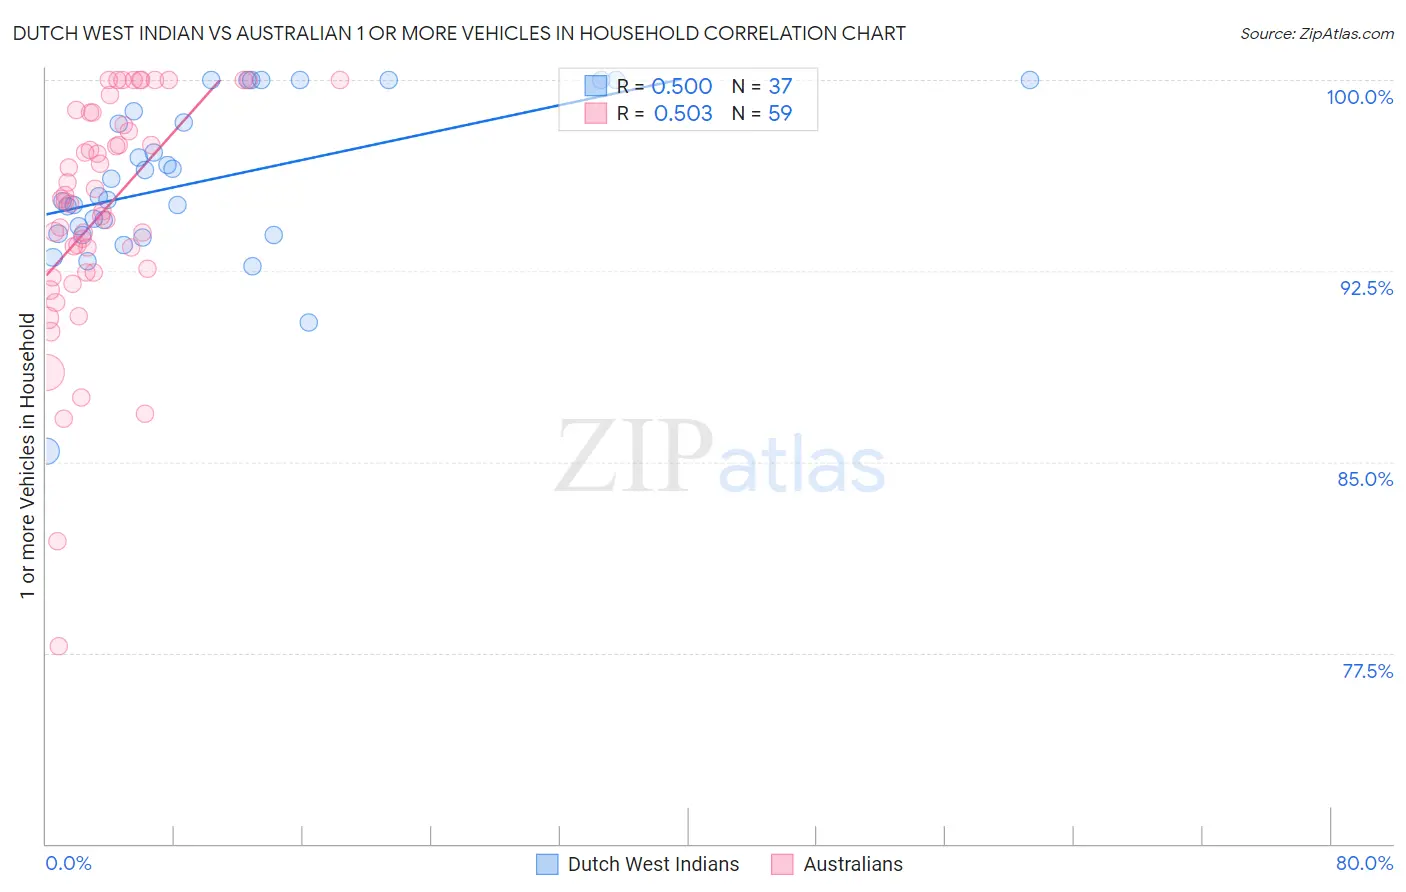
The statistical analysis conducted on geographies consisting of 85,766,145 people shows a moderate positive correlation between the proportion of Dutch West Indians and percentage of households with 1 or more vehicles available in the United States with a correlation coefficient (R) of 0.500 and weighted average of 89.0%. Similarly, the statistical analysis conducted on geographies consisting of 224,001,878 people shows a substantial positive correlation between the proportion of Australians and percentage of households with 1 or more vehicles available in the United States with a correlation coefficient (R) of 0.503 and weighted average of 90.0%, a difference of 1.1%.
1 or more Vehicles in Household Correlation Summary
| Measurement | Dutch West Indian | Australian |
| Minimum | 85.4% | 77.7% |
| Maximum | 100.0% | 100.0% |
| Range | 14.6% | 22.3% |
| Mean | 96.0% | 94.8% |
| Median | 95.4% | 95.3% |
| Interquartile 25% (IQ1) | 93.9% | 92.4% |
| Interquartile 75% (IQ3) | 99.4% | 98.7% |
| Interquartile Range (IQR) | 5.4% | 6.3% |
| Standard Deviation (Sample) | 3.2% | 4.6% |
| Standard Deviation (Population) | 3.2% | 4.6% |
Similar Demographics by 1 or more Vehicles in Household
Demographics Similar to Dutch West Indians by 1 or more Vehicles in Household
In terms of 1 or more vehicles in household, the demographic groups most similar to Dutch West Indians are Immigrants from Italy (89.1%, a difference of 0.020%), Sierra Leonean (89.0%, a difference of 0.020%), Immigrants from Chile (89.1%, a difference of 0.030%), Somali (89.0%, a difference of 0.030%), and Immigrants from Denmark (89.1%, a difference of 0.040%).
| Demographics | Rating | Rank | 1 or more Vehicles in Household |
| Cambodians | 18.9 /100 | #203 | Poor 89.2% |
| Romanians | 18.2 /100 | #204 | Poor 89.2% |
| Guatemalans | 17.8 /100 | #205 | Poor 89.2% |
| Apache | 16.2 /100 | #206 | Poor 89.1% |
| Immigrants | Denmark | 14.8 /100 | #207 | Poor 89.1% |
| Immigrants | Chile | 14.4 /100 | #208 | Poor 89.1% |
| Immigrants | Italy | 14.0 /100 | #209 | Poor 89.1% |
| Dutch West Indians | 13.5 /100 | #210 | Poor 89.0% |
| Sierra Leoneans | 13.0 /100 | #211 | Poor 89.0% |
| Somalis | 12.8 /100 | #212 | Poor 89.0% |
| Immigrants | Western Asia | 12.3 /100 | #213 | Poor 89.0% |
| Immigrants | Hungary | 11.9 /100 | #214 | Poor 89.0% |
| Immigrants | Sri Lanka | 10.2 /100 | #215 | Poor 88.9% |
| Immigrants | Argentina | 9.4 /100 | #216 | Tragic 88.9% |
| Argentineans | 8.8 /100 | #217 | Tragic 88.9% |
Demographics Similar to Australians by 1 or more Vehicles in Household
In terms of 1 or more vehicles in household, the demographic groups most similar to Australians are Immigrants (90.1%, a difference of 0.020%), Immigrants from Congo (90.0%, a difference of 0.020%), New Zealander (90.1%, a difference of 0.030%), Immigrants from Uganda (90.1%, a difference of 0.030%), and Brazilian (90.0%, a difference of 0.030%).
| Demographics | Rating | Rank | 1 or more Vehicles in Household |
| Immigrants | Nicaragua | 76.7 /100 | #149 | Good 90.1% |
| Immigrants | Micronesia | 75.9 /100 | #150 | Good 90.1% |
| Immigrants | Bosnia and Herzegovina | 75.4 /100 | #151 | Good 90.1% |
| Tlingit-Haida | 74.3 /100 | #152 | Good 90.1% |
| New Zealanders | 73.8 /100 | #153 | Good 90.1% |
| Immigrants | Uganda | 73.8 /100 | #154 | Good 90.1% |
| Immigrants | Immigrants | 73.6 /100 | #155 | Good 90.1% |
| Australians | 72.4 /100 | #156 | Good 90.0% |
| Immigrants | Congo | 71.2 /100 | #157 | Good 90.0% |
| Brazilians | 71.0 /100 | #158 | Good 90.0% |
| South Africans | 69.7 /100 | #159 | Good 90.0% |
| Immigrants | Indonesia | 68.8 /100 | #160 | Good 90.0% |
| Salvadorans | 68.7 /100 | #161 | Good 90.0% |
| Spanish American Indians | 67.0 /100 | #162 | Good 89.9% |
| Immigrants | Austria | 65.5 /100 | #163 | Good 89.9% |