Central American vs Australian 1 or more Vehicles in Household
COMPARE
Central American
Australian
1 or more Vehicles in Household
1 or more Vehicles in Household Comparison
Central Americans
Australians
89.2%
1 OR MORE VEHICLES IN HOUSEHOLD
21.4/ 100
METRIC RATING
200th/ 347
METRIC RANK
90.0%
1 OR MORE VEHICLES IN HOUSEHOLD
72.4/ 100
METRIC RATING
156th/ 347
METRIC RANK
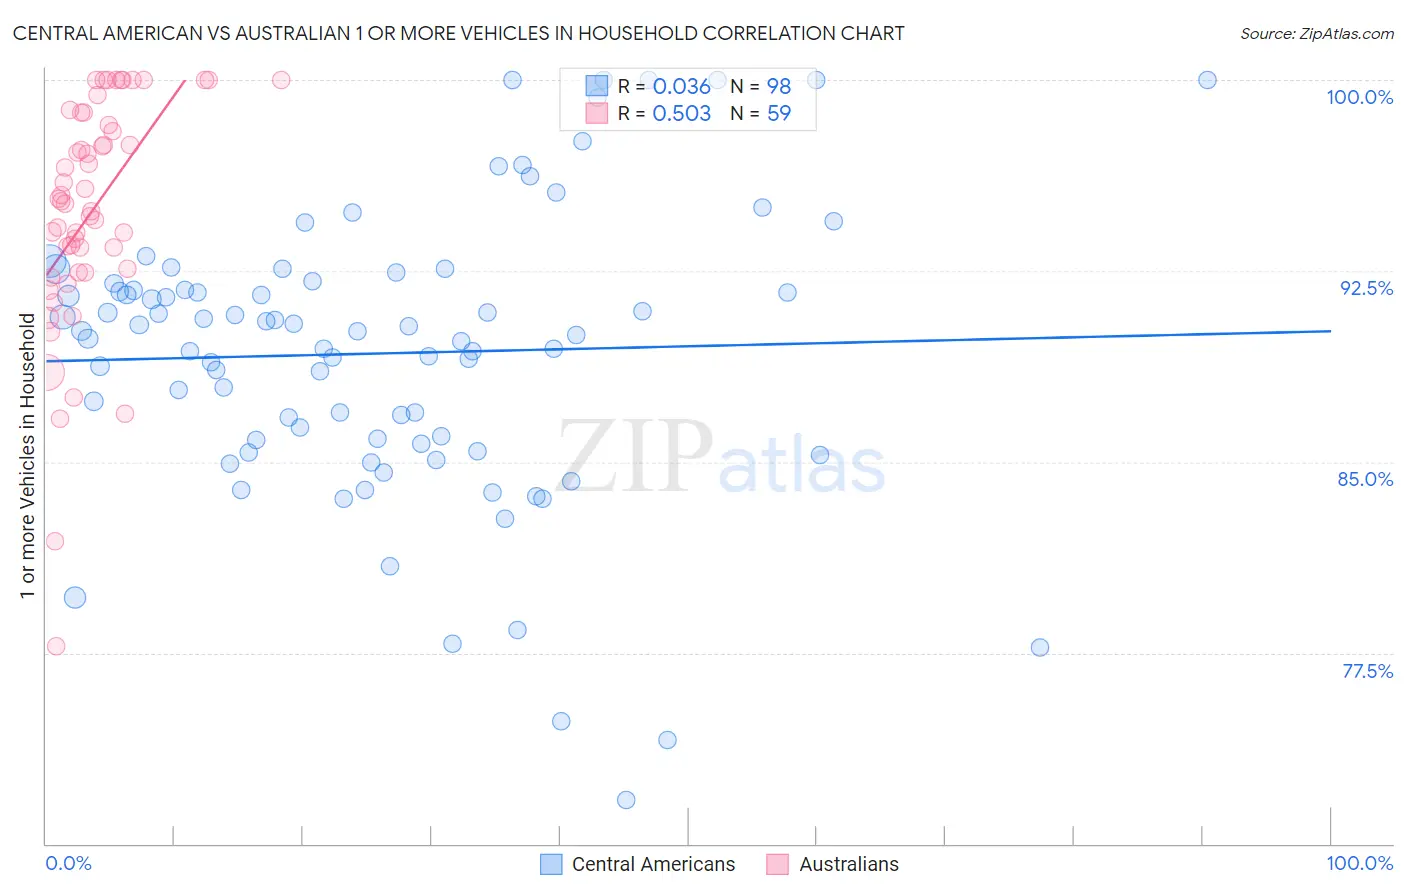
Central American vs Australian 1 or more Vehicles in Household Correlation Chart
The statistical analysis conducted on geographies consisting of 504,154,772 people shows no correlation between the proportion of Central Americans and percentage of households with 1 or more vehicles available in the United States with a correlation coefficient (R) of 0.036 and weighted average of 89.2%. Similarly, the statistical analysis conducted on geographies consisting of 224,001,878 people shows a substantial positive correlation between the proportion of Australians and percentage of households with 1 or more vehicles available in the United States with a correlation coefficient (R) of 0.503 and weighted average of 90.0%, a difference of 0.89%.
1 or more Vehicles in Household Correlation Summary
| Measurement | Central American | Australian |
| Minimum | 71.7% | 77.7% |
| Maximum | 100.0% | 100.0% |
| Range | 28.3% | 22.3% |
| Mean | 89.3% | 94.8% |
| Median | 90.1% | 95.3% |
| Interquartile 25% (IQ1) | 85.8% | 92.4% |
| Interquartile 75% (IQ3) | 92.0% | 98.7% |
| Interquartile Range (IQR) | 6.2% | 6.3% |
| Standard Deviation (Sample) | 5.7% | 4.6% |
| Standard Deviation (Population) | 5.6% | 4.6% |
Similar Demographics by 1 or more Vehicles in Household
Demographics Similar to Central Americans by 1 or more Vehicles in Household
In terms of 1 or more vehicles in household, the demographic groups most similar to Central Americans are Immigrants from Western Europe (89.2%, a difference of 0.020%), Immigrants from Asia (89.3%, a difference of 0.030%), Pennsylvania German (89.3%, a difference of 0.040%), Iroquois (89.2%, a difference of 0.040%), and Immigrants from Sweden (89.3%, a difference of 0.050%).
| Demographics | Rating | Rank | 1 or more Vehicles in Household |
| Immigrants | Northern Europe | 35.5 /100 | #193 | Fair 89.5% |
| Immigrants | Eritrea | 33.2 /100 | #194 | Fair 89.4% |
| Immigrants | Armenia | 31.8 /100 | #195 | Fair 89.4% |
| Crow | 24.3 /100 | #196 | Fair 89.3% |
| Immigrants | Sweden | 23.6 /100 | #197 | Fair 89.3% |
| Pennsylvania Germans | 22.9 /100 | #198 | Fair 89.3% |
| Immigrants | Asia | 22.8 /100 | #199 | Fair 89.3% |
| Central Americans | 21.4 /100 | #200 | Fair 89.2% |
| Immigrants | Western Europe | 20.5 /100 | #201 | Fair 89.2% |
| Iroquois | 19.8 /100 | #202 | Poor 89.2% |
| Cambodians | 18.9 /100 | #203 | Poor 89.2% |
| Romanians | 18.2 /100 | #204 | Poor 89.2% |
| Guatemalans | 17.8 /100 | #205 | Poor 89.2% |
| Apache | 16.2 /100 | #206 | Poor 89.1% |
| Immigrants | Denmark | 14.8 /100 | #207 | Poor 89.1% |
Demographics Similar to Australians by 1 or more Vehicles in Household
In terms of 1 or more vehicles in household, the demographic groups most similar to Australians are Immigrants (90.1%, a difference of 0.020%), Immigrants from Congo (90.0%, a difference of 0.020%), New Zealander (90.1%, a difference of 0.030%), Immigrants from Uganda (90.1%, a difference of 0.030%), and Brazilian (90.0%, a difference of 0.030%).
| Demographics | Rating | Rank | 1 or more Vehicles in Household |
| Immigrants | Nicaragua | 76.7 /100 | #149 | Good 90.1% |
| Immigrants | Micronesia | 75.9 /100 | #150 | Good 90.1% |
| Immigrants | Bosnia and Herzegovina | 75.4 /100 | #151 | Good 90.1% |
| Tlingit-Haida | 74.3 /100 | #152 | Good 90.1% |
| New Zealanders | 73.8 /100 | #153 | Good 90.1% |
| Immigrants | Uganda | 73.8 /100 | #154 | Good 90.1% |
| Immigrants | Immigrants | 73.6 /100 | #155 | Good 90.1% |
| Australians | 72.4 /100 | #156 | Good 90.0% |
| Immigrants | Congo | 71.2 /100 | #157 | Good 90.0% |
| Brazilians | 71.0 /100 | #158 | Good 90.0% |
| South Africans | 69.7 /100 | #159 | Good 90.0% |
| Immigrants | Indonesia | 68.8 /100 | #160 | Good 90.0% |
| Salvadorans | 68.7 /100 | #161 | Good 90.0% |
| Spanish American Indians | 67.0 /100 | #162 | Good 89.9% |
| Immigrants | Austria | 65.5 /100 | #163 | Good 89.9% |