Zip Codes with the Highest Percentage of Families with Income Above $200,000 in Newport News, VA

RELATED REPORTS & OPTIONS

Family Income | $200k+
Population
Families and Households
Female Fertility
Female Fertility (Unmarried)
Race (Community Size)
Race (Percentage)
Ancestry (Community Size)
AfricanAlsatianAmericanArabArmenianAustrianBelgianBhutaneseBlackfeetBrazilianBritishBritish West IndianBulgarianBurmeseCanadianCape VerdeanCelticCentral AmericanCherokeeColombianCosta RicanCroatianCubanCzechCzechoslovakianDanishDominicanDutchEastern EuropeanEcuadorianEgyptianEnglishEthiopianEuropeanFilipinoFinnishFrenchFrench CanadianGermanGreekGuatemalanGuyaneseHaitianHonduranHungarianIndian (Asian)IraqiIrishIsraeliItalianJamaicanJapaneseKoreanLebaneseLithuanianLumbeeMexicanNative HawaiianNicaraguanNigerianNorthern EuropeanNorwegianPakistaniPanamanianPeruvianPolishPortuguesePuerto RicanRomanianRussianSalvadoranSamoanScandinavianScotch-IrishScottishSerbianSiouxSlovakSloveneSouth AmericanSpaniardSpanishSri LankanSubsaharan AfricanSwedishSwissThaiTrinidadian and TobagonianTurkishUkrainianWelshWest IndianYugoslavian
Ancestry (Percentage)
AfricanAlsatianAmericanArabArmenianAustrianBelgianBhutaneseBlackfeetBrazilianBritishBritish West IndianBulgarianBurmeseCanadianCape VerdeanCelticCentral AmericanCherokeeColombianCosta RicanCroatianCubanCzechCzechoslovakianDanishDominicanDutchEastern EuropeanEcuadorianEgyptianEnglishEthiopianEuropeanFilipinoFinnishFrenchFrench CanadianGermanGreekGuatemalanGuyaneseHaitianHonduranHungarianIndian (Asian)IraqiIrishIsraeliItalianJamaicanJapaneseKoreanLebaneseLithuanianLumbeeMexicanNative HawaiianNicaraguanNigerianNorthern EuropeanNorwegianPakistaniPanamanianPeruvianPolishPortuguesePuerto RicanRomanianRussianSalvadoranSamoanScandinavianScotch-IrishScottishSerbianSiouxSlovakSloveneSouth AmericanSpaniardSpanishSri LankanSubsaharan AfricanSwedishSwissThaiTrinidadian and TobagonianTurkishUkrainianWelshWest IndianYugoslavian
Immigrant Origin (Total)
Immigrant Origin (Percentage)
Income
Income (Families)
Income (Households)
Poverty
Poverty (Families)
Unemployment
Employment Occupations
Employment Industries
Employer Class
Commute Time
Commute Means
School Enrollment
Education by Degree Field
Occupancy
Finances
Physical Characteristics
Newport News
Compare Zip Codes
Comparison Subject

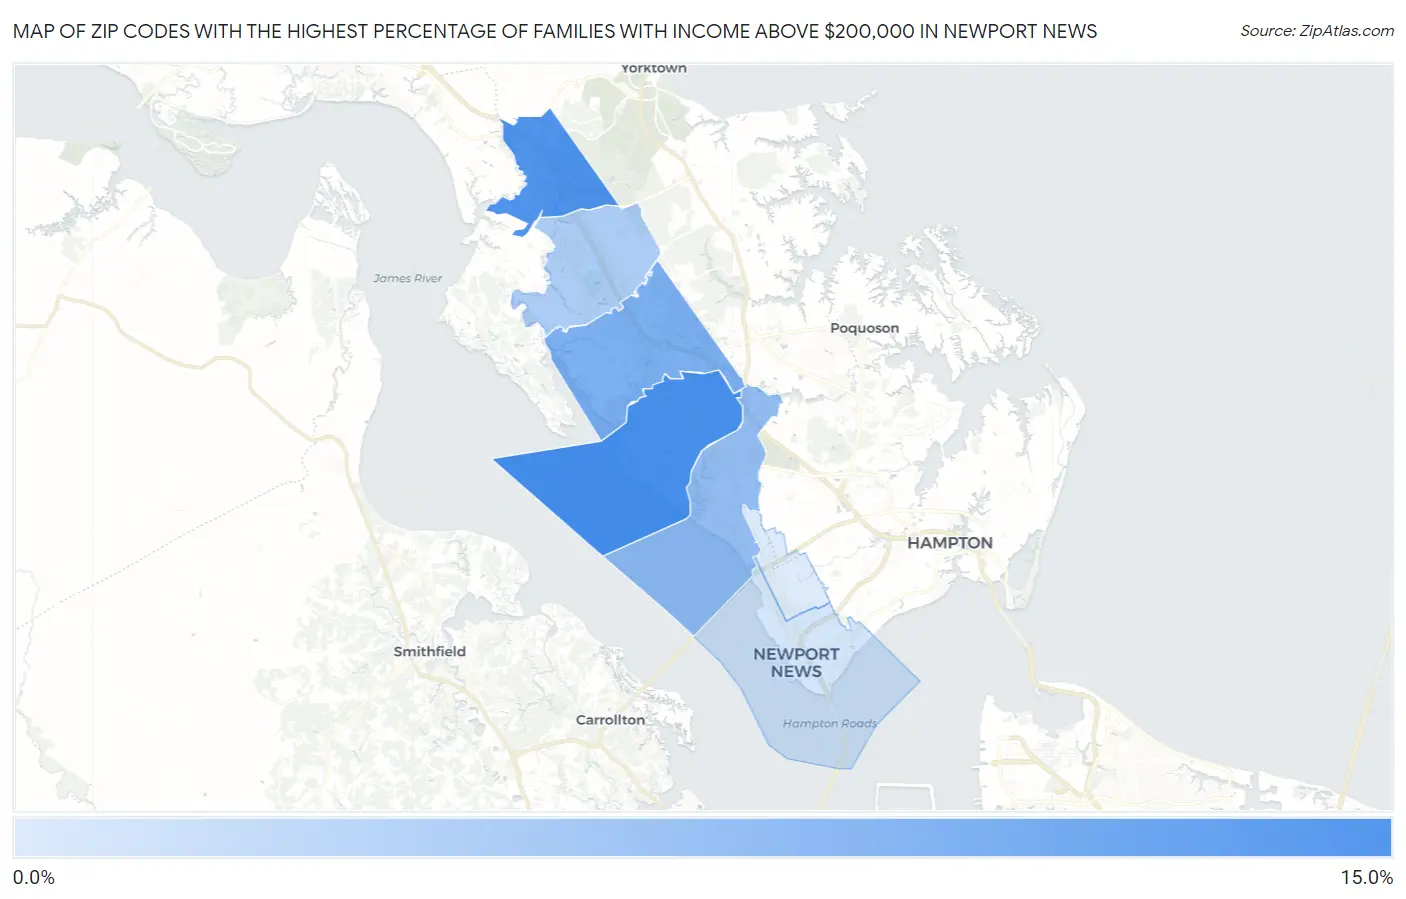
Map of Zip Codes with the Highest Percentage of Families with Income Above $200,000 in Newport News

0.0%
15.0%
Zip Codes with the Highest Percentage of Families with Income Above $200,000 in Newport News Map

Zip Codes with the Highest Percentage of Families with Income Above $200,000 in Newport News, VA

Zip Code Families with Income > $200k vs State vs National
1.2360612.2%20.4%(-8.20)#29914.8%(-2.60)#8,799
2.2360311.6%20.4%(-8.80)#31114.8%(-3.20)#9,302
3.236028.2%20.4%(-12.2)#40014.8%(-6.60)#12,903
4.236016.5%20.4%(-13.9)#45014.8%(-8.30)#15,518
5.236084.7%20.4%(-15.7)#52214.8%(-10.1)#18,985
6.236071.9%20.4%(-18.5)#63814.8%(-12.9)#24,623
7.236051.2%20.4%(-19.2)#67114.8%(-13.6)#25,788

Common Questions

What are the Top 5 Zip Codes with the Highest Percentage of Families with Income Above $200,000 in Newport News, VA?
Top 5 Zip Codes with the Highest Percentage of Families with Income Above $200,000 in Newport News, VA are:
#1
12.2%
#2
11.6%
#3
8.2%
#4
6.5%
#5
4.7%
What zip code has the Highest Percentage of Families with Income Above $200,000 in Newport News, VA?
23606 has the Highest Percentage of Families with Income Above $200,000 in Newport News, VA with 12.2%.
What is the Percentage of Families with Income Above $200,000 in Newport News, VA?
Percentage of Families with Income Above $200,000 in Newport News is 6.5%.
What is the Percentage of Families with Income Above $200,000 in Virginia?
Percentage of Families with Income Above $200,000 in Virginia is 20.4%.
What is the Percentage of Families with Income Above $200,000 in the United States?
Percentage of Families with Income Above $200,000 in the United States is 14.8%.