Immigrants from Eastern Asia vs Inupiat Female Unemployment
COMPARE
Immigrants from Eastern Asia
Inupiat
Female Unemployment
Female Unemployment Comparison
Immigrants from Eastern Asia
Inupiat
5.1%
FEMALE UNEMPLOYMENT
83.0/ 100
METRIC RATING
139th/ 347
METRIC RANK
8.2%
FEMALE UNEMPLOYMENT
0.0/ 100
METRIC RATING
341st/ 347
METRIC RANK
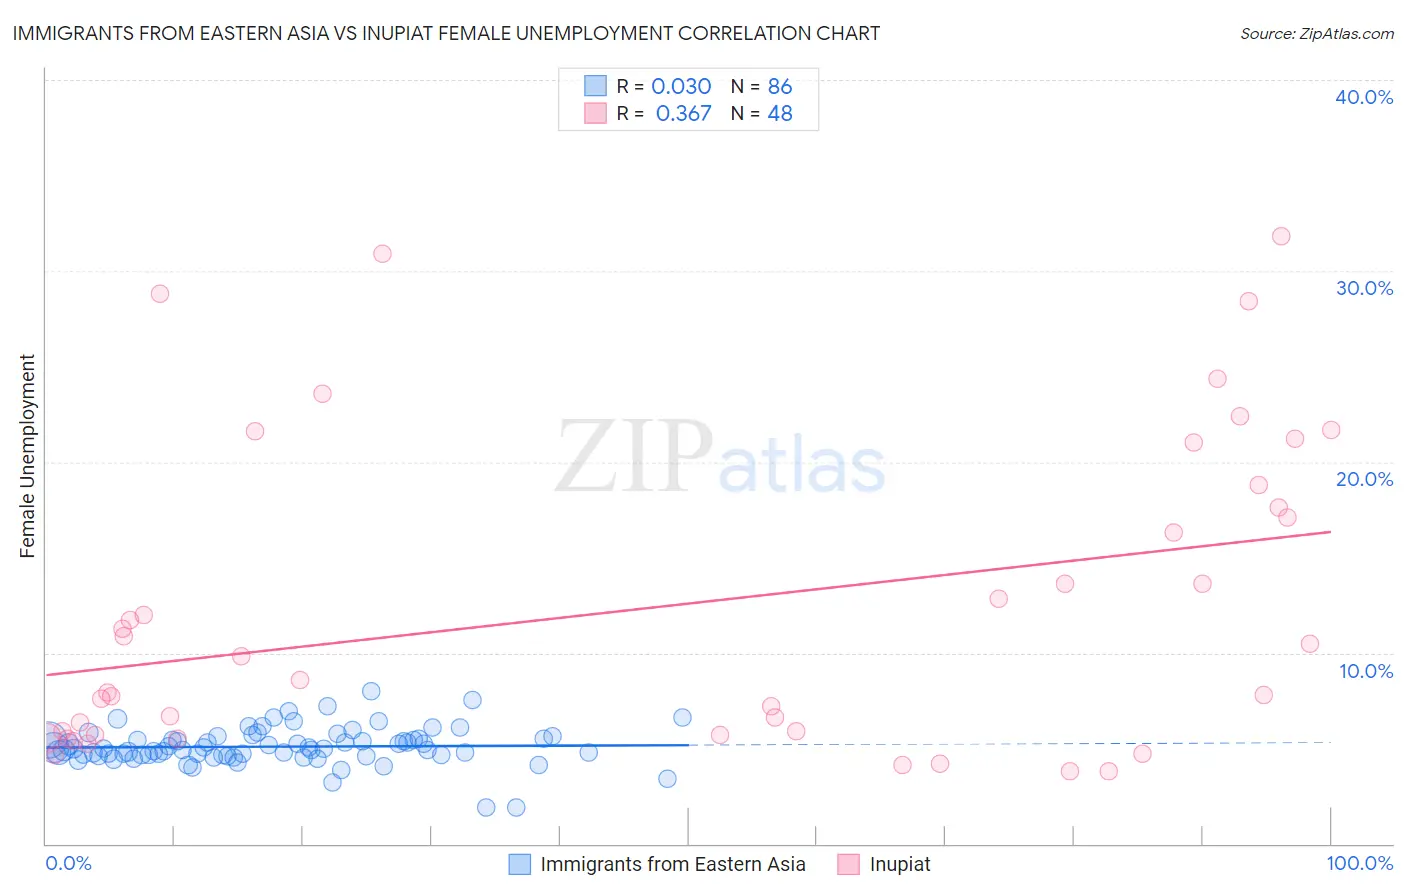
Immigrants from Eastern Asia vs Inupiat Female Unemployment Correlation Chart
The statistical analysis conducted on geographies consisting of 495,373,600 people shows no correlation between the proportion of Immigrants from Eastern Asia and unemploymnet rate among females in the United States with a correlation coefficient (R) of 0.030 and weighted average of 5.1%. Similarly, the statistical analysis conducted on geographies consisting of 96,139,159 people shows a mild positive correlation between the proportion of Inupiat and unemploymnet rate among females in the United States with a correlation coefficient (R) of 0.367 and weighted average of 8.2%, a difference of 58.9%.
Female Unemployment Correlation Summary
| Measurement | Immigrants from Eastern Asia | Inupiat |
| Minimum | 1.9% | 3.8% |
| Maximum | 8.0% | 31.8% |
| Range | 6.1% | 28.0% |
| Mean | 5.1% | 12.4% |
| Median | 5.0% | 9.2% |
| Interquartile 25% (IQ1) | 4.6% | 5.7% |
| Interquartile 75% (IQ3) | 5.5% | 18.2% |
| Interquartile Range (IQR) | 0.85% | 12.5% |
| Standard Deviation (Sample) | 0.97% | 8.1% |
| Standard Deviation (Population) | 0.96% | 8.0% |
Similar Demographics by Female Unemployment
Demographics Similar to Immigrants from Eastern Asia by Female Unemployment
In terms of female unemployment, the demographic groups most similar to Immigrants from Eastern Asia are Chickasaw (5.1%, a difference of 0.020%), Immigrants from France (5.1%, a difference of 0.040%), Pakistani (5.1%, a difference of 0.080%), Indian (Asian) (5.1%, a difference of 0.13%), and Immigrants from Eastern Europe (5.1%, a difference of 0.16%).
| Demographics | Rating | Rank | Female Unemployment |
| Immigrants | Sri Lanka | 85.0 /100 | #132 | Excellent 5.1% |
| Immigrants | Hong Kong | 84.8 /100 | #133 | Excellent 5.1% |
| Immigrants | Eritrea | 84.6 /100 | #134 | Excellent 5.1% |
| Immigrants | Latvia | 84.6 /100 | #135 | Excellent 5.1% |
| Indians (Asian) | 84.2 /100 | #136 | Excellent 5.1% |
| Pakistanis | 83.8 /100 | #137 | Excellent 5.1% |
| Chickasaw | 83.2 /100 | #138 | Excellent 5.1% |
| Immigrants | Eastern Asia | 83.0 /100 | #139 | Excellent 5.1% |
| Immigrants | France | 82.7 /100 | #140 | Excellent 5.1% |
| Immigrants | Eastern Europe | 81.5 /100 | #141 | Excellent 5.1% |
| Palestinians | 80.8 /100 | #142 | Excellent 5.1% |
| Immigrants | Kazakhstan | 80.7 /100 | #143 | Excellent 5.1% |
| Immigrants | Jordan | 80.4 /100 | #144 | Excellent 5.1% |
| Immigrants | Oceania | 79.5 /100 | #145 | Good 5.2% |
| Immigrants | Norway | 79.4 /100 | #146 | Good 5.2% |
Demographics Similar to Inupiat by Female Unemployment
In terms of female unemployment, the demographic groups most similar to Inupiat are Hopi (8.1%, a difference of 0.76%), Puerto Rican (8.3%, a difference of 2.2%), Immigrants from Yemen (7.8%, a difference of 4.1%), Tohono O'odham (7.7%, a difference of 5.3%), and Arapaho (8.8%, a difference of 7.7%).
| Demographics | Rating | Rank | Female Unemployment |
| Menominee | 0.0 /100 | #333 | Tragic 7.0% |
| Immigrants | Armenia | 0.0 /100 | #334 | Tragic 7.1% |
| Dominicans | 0.0 /100 | #335 | Tragic 7.2% |
| Immigrants | Dominican Republic | 0.0 /100 | #336 | Tragic 7.2% |
| Navajo | 0.0 /100 | #337 | Tragic 7.3% |
| Tohono O'odham | 0.0 /100 | #338 | Tragic 7.7% |
| Immigrants | Yemen | 0.0 /100 | #339 | Tragic 7.8% |
| Hopi | 0.0 /100 | #340 | Tragic 8.1% |
| Inupiat | 0.0 /100 | #341 | Tragic 8.2% |
| Puerto Ricans | 0.0 /100 | #342 | Tragic 8.3% |
| Arapaho | 0.0 /100 | #343 | Tragic 8.8% |
| Pima | 0.0 /100 | #344 | Tragic 9.3% |
| Yuman | 0.0 /100 | #345 | Tragic 9.6% |
| Yup'ik | 0.0 /100 | #346 | Tragic 10.9% |
| Crow | 0.0 /100 | #347 | Tragic 12.1% |