Immigrants from Saudi Arabia vs Inupiat Female Unemployment
COMPARE
Immigrants from Saudi Arabia
Inupiat
Female Unemployment
Female Unemployment Comparison
Immigrants from Saudi Arabia
Inupiat
5.1%
FEMALE UNEMPLOYMENT
91.2/ 100
METRIC RATING
113th/ 347
METRIC RANK
8.2%
FEMALE UNEMPLOYMENT
0.0/ 100
METRIC RATING
341st/ 347
METRIC RANK
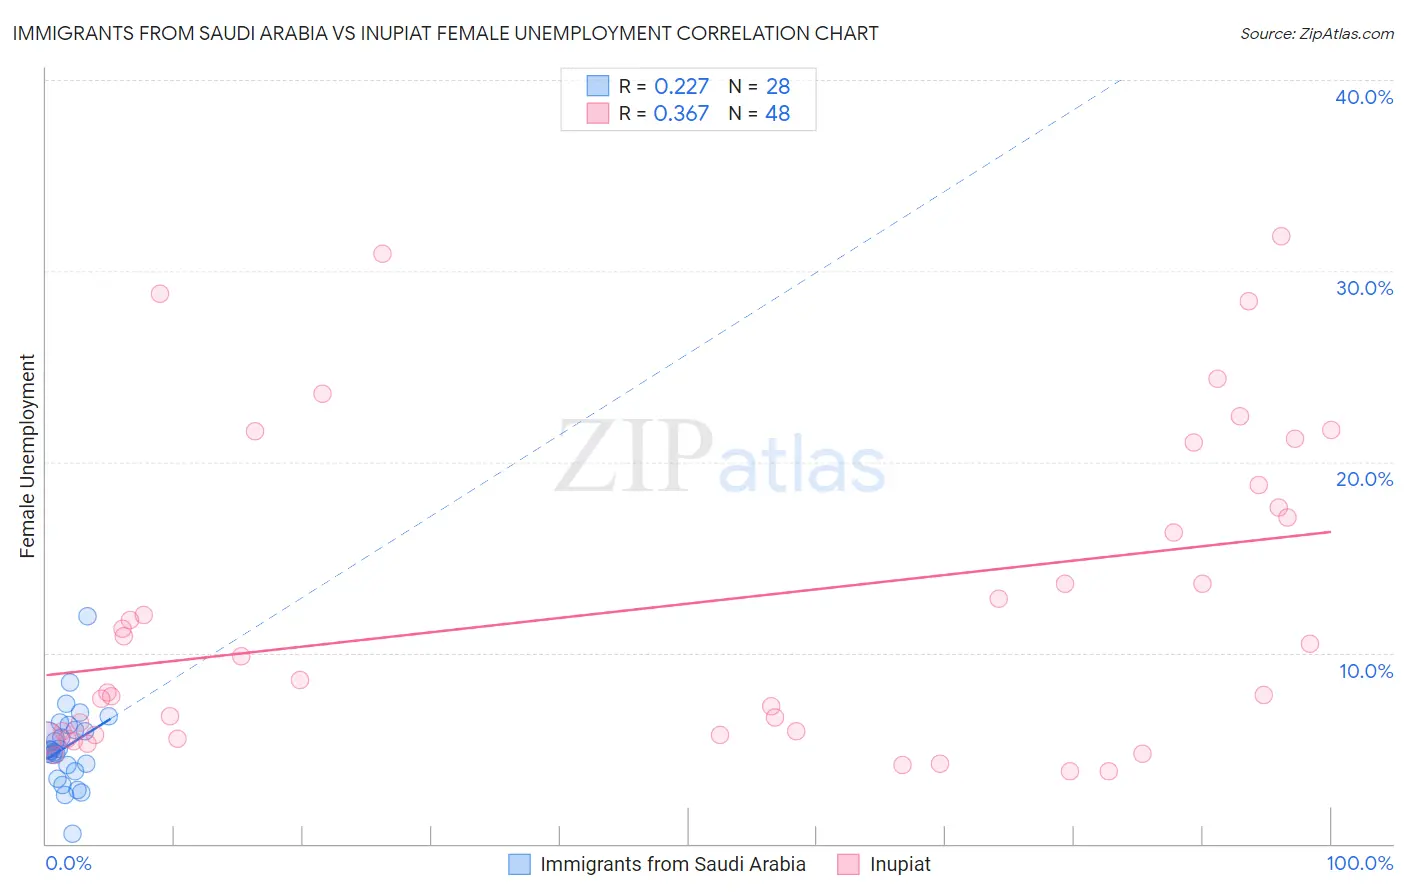
Immigrants from Saudi Arabia vs Inupiat Female Unemployment Correlation Chart
The statistical analysis conducted on geographies consisting of 164,209,507 people shows a weak positive correlation between the proportion of Immigrants from Saudi Arabia and unemploymnet rate among females in the United States with a correlation coefficient (R) of 0.227 and weighted average of 5.1%. Similarly, the statistical analysis conducted on geographies consisting of 96,139,159 people shows a mild positive correlation between the proportion of Inupiat and unemploymnet rate among females in the United States with a correlation coefficient (R) of 0.367 and weighted average of 8.2%, a difference of 60.8%.
Female Unemployment Correlation Summary
| Measurement | Immigrants from Saudi Arabia | Inupiat |
| Minimum | 0.50% | 3.8% |
| Maximum | 11.9% | 31.8% |
| Range | 11.4% | 28.0% |
| Mean | 5.1% | 12.4% |
| Median | 4.9% | 9.2% |
| Interquartile 25% (IQ1) | 4.0% | 5.7% |
| Interquartile 75% (IQ3) | 6.1% | 18.2% |
| Interquartile Range (IQR) | 2.1% | 12.5% |
| Standard Deviation (Sample) | 2.1% | 8.1% |
| Standard Deviation (Population) | 2.1% | 8.0% |
Similar Demographics by Female Unemployment
Demographics Similar to Immigrants from Saudi Arabia by Female Unemployment
In terms of female unemployment, the demographic groups most similar to Immigrants from Saudi Arabia are Immigrants from Turkey (5.1%, a difference of 0.040%), Lebanese (5.1%, a difference of 0.050%), American (5.1%, a difference of 0.13%), Estonian (5.1%, a difference of 0.18%), and Jordanian (5.1%, a difference of 0.18%).
| Demographics | Rating | Rank | Female Unemployment |
| Paraguayans | 93.2 /100 | #106 | Exceptional 5.1% |
| Immigrants | Switzerland | 93.1 /100 | #107 | Exceptional 5.1% |
| Puget Sound Salish | 93.0 /100 | #108 | Exceptional 5.1% |
| Immigrants | Eastern Africa | 92.8 /100 | #109 | Exceptional 5.1% |
| Macedonians | 92.4 /100 | #110 | Exceptional 5.1% |
| Immigrants | Burma/Myanmar | 92.3 /100 | #111 | Exceptional 5.1% |
| Estonians | 92.1 /100 | #112 | Exceptional 5.1% |
| Immigrants | Saudi Arabia | 91.2 /100 | #113 | Exceptional 5.1% |
| Immigrants | Turkey | 91.0 /100 | #114 | Exceptional 5.1% |
| Lebanese | 91.0 /100 | #115 | Exceptional 5.1% |
| Americans | 90.5 /100 | #116 | Exceptional 5.1% |
| Jordanians | 90.3 /100 | #117 | Exceptional 5.1% |
| Immigrants | Croatia | 89.9 /100 | #118 | Excellent 5.1% |
| Immigrants | North Macedonia | 88.3 /100 | #119 | Excellent 5.1% |
| Immigrants | Romania | 88.1 /100 | #120 | Excellent 5.1% |
Demographics Similar to Inupiat by Female Unemployment
In terms of female unemployment, the demographic groups most similar to Inupiat are Hopi (8.1%, a difference of 0.76%), Puerto Rican (8.3%, a difference of 2.2%), Immigrants from Yemen (7.8%, a difference of 4.1%), Tohono O'odham (7.7%, a difference of 5.3%), and Arapaho (8.8%, a difference of 7.7%).
| Demographics | Rating | Rank | Female Unemployment |
| Menominee | 0.0 /100 | #333 | Tragic 7.0% |
| Immigrants | Armenia | 0.0 /100 | #334 | Tragic 7.1% |
| Dominicans | 0.0 /100 | #335 | Tragic 7.2% |
| Immigrants | Dominican Republic | 0.0 /100 | #336 | Tragic 7.2% |
| Navajo | 0.0 /100 | #337 | Tragic 7.3% |
| Tohono O'odham | 0.0 /100 | #338 | Tragic 7.7% |
| Immigrants | Yemen | 0.0 /100 | #339 | Tragic 7.8% |
| Hopi | 0.0 /100 | #340 | Tragic 8.1% |
| Inupiat | 0.0 /100 | #341 | Tragic 8.2% |
| Puerto Ricans | 0.0 /100 | #342 | Tragic 8.3% |
| Arapaho | 0.0 /100 | #343 | Tragic 8.8% |
| Pima | 0.0 /100 | #344 | Tragic 9.3% |
| Yuman | 0.0 /100 | #345 | Tragic 9.6% |
| Yup'ik | 0.0 /100 | #346 | Tragic 10.9% |
| Crow | 0.0 /100 | #347 | Tragic 12.1% |