Zimbabwean vs New Zealander Female Unemployment
COMPARE
Zimbabwean
New Zealander
Female Unemployment
Female Unemployment Comparison
Zimbabweans
New Zealanders
4.8%
FEMALE UNEMPLOYMENT
99.7/ 100
METRIC RATING
34th/ 347
METRIC RANK
5.0%
FEMALE UNEMPLOYMENT
97.4/ 100
METRIC RATING
80th/ 347
METRIC RANK
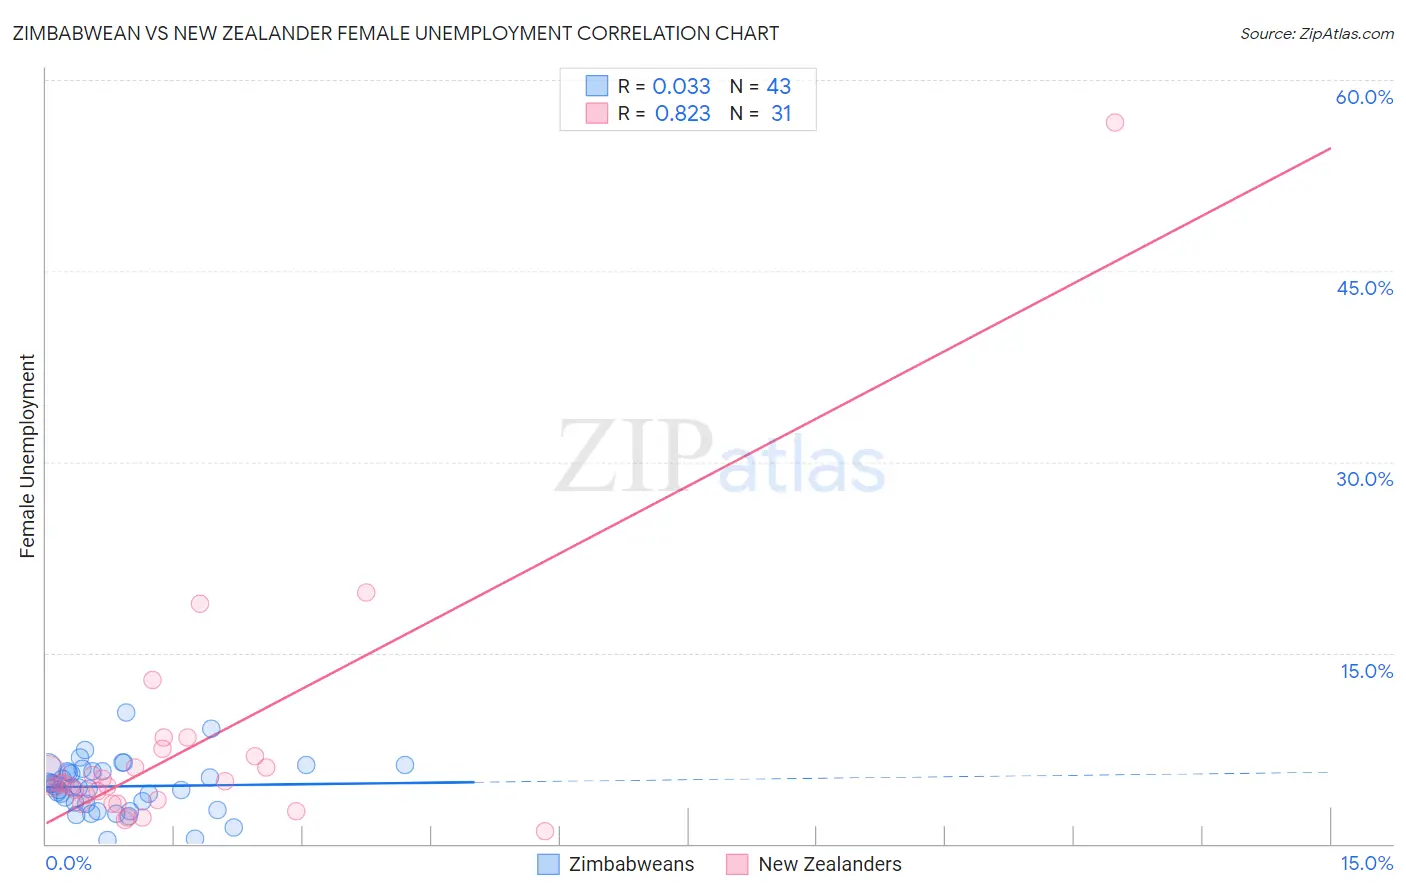
Zimbabwean vs New Zealander Female Unemployment Correlation Chart
The statistical analysis conducted on geographies consisting of 69,190,722 people shows no correlation between the proportion of Zimbabweans and unemploymnet rate among females in the United States with a correlation coefficient (R) of 0.033 and weighted average of 4.8%. Similarly, the statistical analysis conducted on geographies consisting of 106,766,859 people shows a very strong positive correlation between the proportion of New Zealanders and unemploymnet rate among females in the United States with a correlation coefficient (R) of 0.823 and weighted average of 5.0%, a difference of 3.8%.
Female Unemployment Correlation Summary
| Measurement | Zimbabwean | New Zealander |
| Minimum | 0.30% | 1.0% |
| Maximum | 10.3% | 56.7% |
| Range | 10.0% | 55.7% |
| Mean | 4.5% | 7.4% |
| Median | 4.5% | 4.7% |
| Interquartile 25% (IQ1) | 3.1% | 3.2% |
| Interquartile 75% (IQ3) | 5.7% | 6.9% |
| Interquartile Range (IQR) | 2.6% | 3.7% |
| Standard Deviation (Sample) | 2.0% | 10.1% |
| Standard Deviation (Population) | 2.0% | 9.9% |
Similar Demographics by Female Unemployment
Demographics Similar to Zimbabweans by Female Unemployment
In terms of female unemployment, the demographic groups most similar to Zimbabweans are Czechoslovakian (4.8%, a difference of 0.030%), French Canadian (4.8%, a difference of 0.060%), Yugoslavian (4.8%, a difference of 0.21%), Slovak (4.8%, a difference of 0.54%), and Pennsylvania German (4.8%, a difference of 0.57%).
| Demographics | Rating | Rank | Female Unemployment |
| British | 99.9 /100 | #27 | Exceptional 4.7% |
| Irish | 99.9 /100 | #28 | Exceptional 4.7% |
| Cypriots | 99.9 /100 | #29 | Exceptional 4.7% |
| Lithuanians | 99.8 /100 | #30 | Exceptional 4.7% |
| Sudanese | 99.8 /100 | #31 | Exceptional 4.8% |
| Slovaks | 99.8 /100 | #32 | Exceptional 4.8% |
| Czechoslovakians | 99.7 /100 | #33 | Exceptional 4.8% |
| Zimbabweans | 99.7 /100 | #34 | Exceptional 4.8% |
| French Canadians | 99.7 /100 | #35 | Exceptional 4.8% |
| Yugoslavians | 99.7 /100 | #36 | Exceptional 4.8% |
| Pennsylvania Germans | 99.6 /100 | #37 | Exceptional 4.8% |
| Northern Europeans | 99.6 /100 | #38 | Exceptional 4.8% |
| Scotch-Irish | 99.6 /100 | #39 | Exceptional 4.8% |
| French | 99.6 /100 | #40 | Exceptional 4.8% |
| Tongans | 99.5 /100 | #41 | Exceptional 4.8% |
Demographics Similar to New Zealanders by Female Unemployment
In terms of female unemployment, the demographic groups most similar to New Zealanders are Filipino (5.0%, a difference of 0.020%), Immigrants from Australia (5.0%, a difference of 0.070%), Immigrants from Serbia (5.0%, a difference of 0.090%), Turkish (5.0%, a difference of 0.12%), and Canadian (5.0%, a difference of 0.13%).
| Demographics | Rating | Rank | Female Unemployment |
| Russians | 98.0 /100 | #73 | Exceptional 5.0% |
| Immigrants | Bolivia | 98.0 /100 | #74 | Exceptional 5.0% |
| Immigrants | Singapore | 98.0 /100 | #75 | Exceptional 5.0% |
| Immigrants | Venezuela | 97.9 /100 | #76 | Exceptional 5.0% |
| Mongolians | 97.8 /100 | #77 | Exceptional 5.0% |
| Immigrants | Netherlands | 97.8 /100 | #78 | Exceptional 5.0% |
| Turks | 97.6 /100 | #79 | Exceptional 5.0% |
| New Zealanders | 97.4 /100 | #80 | Exceptional 5.0% |
| Filipinos | 97.3 /100 | #81 | Exceptional 5.0% |
| Immigrants | Australia | 97.3 /100 | #82 | Exceptional 5.0% |
| Immigrants | Serbia | 97.2 /100 | #83 | Exceptional 5.0% |
| Canadians | 97.2 /100 | #84 | Exceptional 5.0% |
| Ukrainians | 97.1 /100 | #85 | Exceptional 5.0% |
| Bolivians | 97.1 /100 | #86 | Exceptional 5.0% |
| Venezuelans | 96.9 /100 | #87 | Exceptional 5.0% |