Immigrants from Uganda vs Inupiat Female Unemployment
COMPARE
Immigrants from Uganda
Inupiat
Female Unemployment
Female Unemployment Comparison
Immigrants from Uganda
Inupiat
5.3%
FEMALE UNEMPLOYMENT
50.7/ 100
METRIC RATING
172nd/ 347
METRIC RANK
8.2%
FEMALE UNEMPLOYMENT
0.0/ 100
METRIC RATING
341st/ 347
METRIC RANK
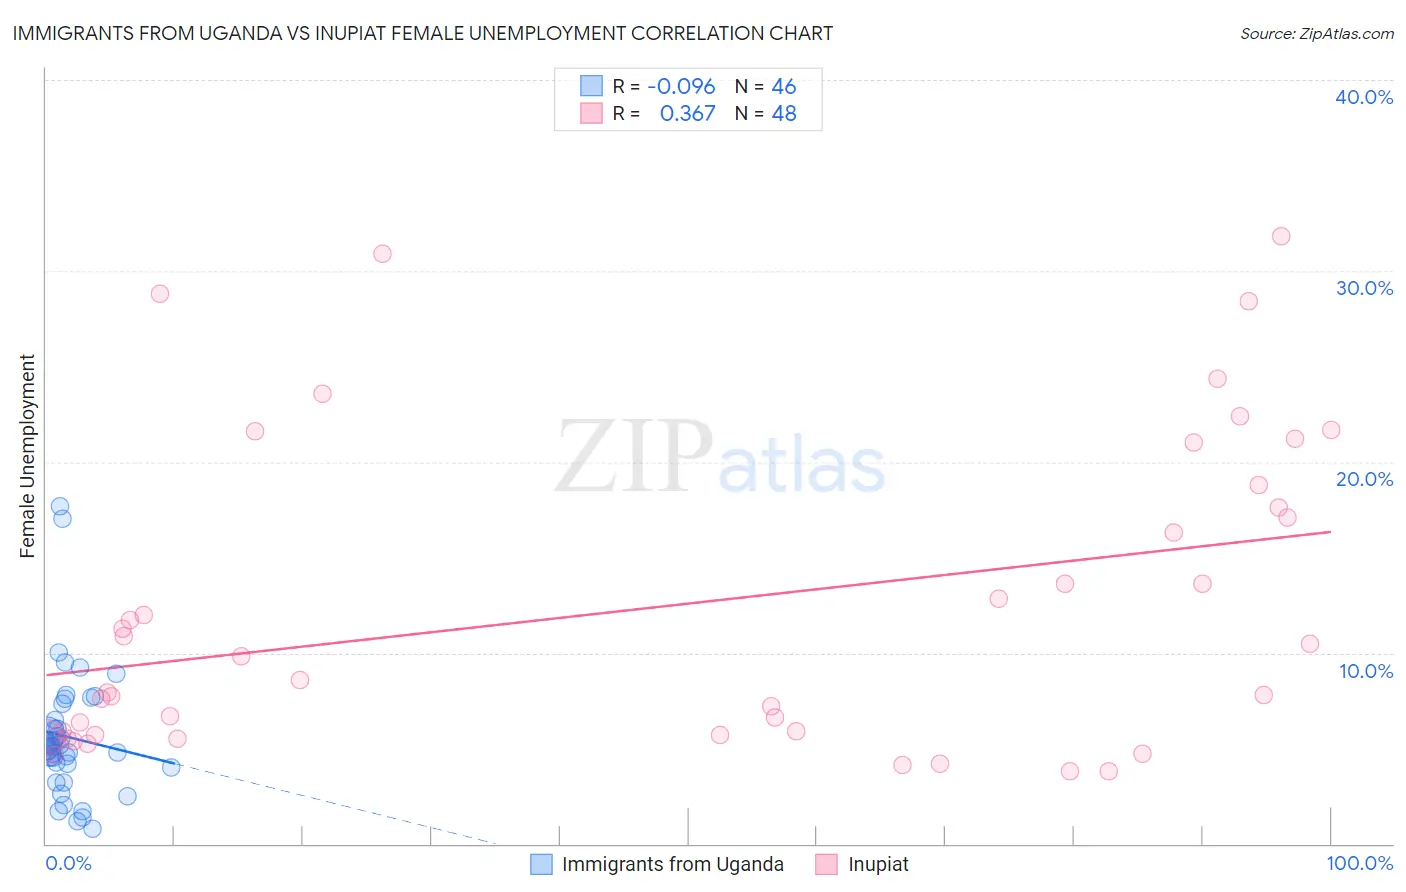
Immigrants from Uganda vs Inupiat Female Unemployment Correlation Chart
The statistical analysis conducted on geographies consisting of 125,901,956 people shows a slight negative correlation between the proportion of Immigrants from Uganda and unemploymnet rate among females in the United States with a correlation coefficient (R) of -0.096 and weighted average of 5.3%. Similarly, the statistical analysis conducted on geographies consisting of 96,139,159 people shows a mild positive correlation between the proportion of Inupiat and unemploymnet rate among females in the United States with a correlation coefficient (R) of 0.367 and weighted average of 8.2%, a difference of 55.2%.
Female Unemployment Correlation Summary
| Measurement | Immigrants from Uganda | Inupiat |
| Minimum | 0.80% | 3.8% |
| Maximum | 17.7% | 31.8% |
| Range | 16.9% | 28.0% |
| Mean | 5.6% | 12.4% |
| Median | 5.1% | 9.2% |
| Interquartile 25% (IQ1) | 4.2% | 5.7% |
| Interquartile 75% (IQ3) | 6.5% | 18.2% |
| Interquartile Range (IQR) | 2.3% | 12.5% |
| Standard Deviation (Sample) | 3.4% | 8.1% |
| Standard Deviation (Population) | 3.3% | 8.0% |
Similar Demographics by Female Unemployment
Demographics Similar to Immigrants from Uganda by Female Unemployment
In terms of female unemployment, the demographic groups most similar to Immigrants from Uganda are Iranian (5.3%, a difference of 0.020%), Immigrants from Poland (5.3%, a difference of 0.040%), Immigrants from Laos (5.3%, a difference of 0.19%), Immigrants from Vietnam (5.3%, a difference of 0.19%), and Immigrants from Morocco (5.3%, a difference of 0.20%).
| Demographics | Rating | Rank | Female Unemployment |
| Syrians | 62.8 /100 | #165 | Good 5.2% |
| Native Hawaiians | 62.7 /100 | #166 | Good 5.2% |
| Immigrants | Thailand | 62.1 /100 | #167 | Good 5.2% |
| Sri Lankans | 59.4 /100 | #168 | Average 5.2% |
| Immigrants | Chile | 59.0 /100 | #169 | Average 5.2% |
| Spanish | 55.9 /100 | #170 | Average 5.2% |
| Immigrants | Denmark | 55.0 /100 | #171 | Average 5.2% |
| Immigrants | Uganda | 50.7 /100 | #172 | Average 5.3% |
| Iranians | 50.4 /100 | #173 | Average 5.3% |
| Immigrants | Poland | 50.0 /100 | #174 | Average 5.3% |
| Immigrants | Laos | 47.5 /100 | #175 | Average 5.3% |
| Immigrants | Vietnam | 47.5 /100 | #176 | Average 5.3% |
| Immigrants | Morocco | 47.4 /100 | #177 | Average 5.3% |
| Immigrants | Southern Europe | 46.2 /100 | #178 | Average 5.3% |
| Laotians | 45.1 /100 | #179 | Average 5.3% |
Demographics Similar to Inupiat by Female Unemployment
In terms of female unemployment, the demographic groups most similar to Inupiat are Hopi (8.1%, a difference of 0.76%), Puerto Rican (8.3%, a difference of 2.2%), Immigrants from Yemen (7.8%, a difference of 4.1%), Tohono O'odham (7.7%, a difference of 5.3%), and Arapaho (8.8%, a difference of 7.7%).
| Demographics | Rating | Rank | Female Unemployment |
| Menominee | 0.0 /100 | #333 | Tragic 7.0% |
| Immigrants | Armenia | 0.0 /100 | #334 | Tragic 7.1% |
| Dominicans | 0.0 /100 | #335 | Tragic 7.2% |
| Immigrants | Dominican Republic | 0.0 /100 | #336 | Tragic 7.2% |
| Navajo | 0.0 /100 | #337 | Tragic 7.3% |
| Tohono O'odham | 0.0 /100 | #338 | Tragic 7.7% |
| Immigrants | Yemen | 0.0 /100 | #339 | Tragic 7.8% |
| Hopi | 0.0 /100 | #340 | Tragic 8.1% |
| Inupiat | 0.0 /100 | #341 | Tragic 8.2% |
| Puerto Ricans | 0.0 /100 | #342 | Tragic 8.3% |
| Arapaho | 0.0 /100 | #343 | Tragic 8.8% |
| Pima | 0.0 /100 | #344 | Tragic 9.3% |
| Yuman | 0.0 /100 | #345 | Tragic 9.6% |
| Yup'ik | 0.0 /100 | #346 | Tragic 10.9% |
| Crow | 0.0 /100 | #347 | Tragic 12.1% |