Zimbabwean vs European Female Unemployment
COMPARE
Zimbabwean
European
Female Unemployment
Female Unemployment Comparison
Zimbabweans
Europeans
4.8%
FEMALE UNEMPLOYMENT
99.7/ 100
METRIC RATING
34th/ 347
METRIC RANK
4.7%
FEMALE UNEMPLOYMENT
99.9/ 100
METRIC RATING
22nd/ 347
METRIC RANK
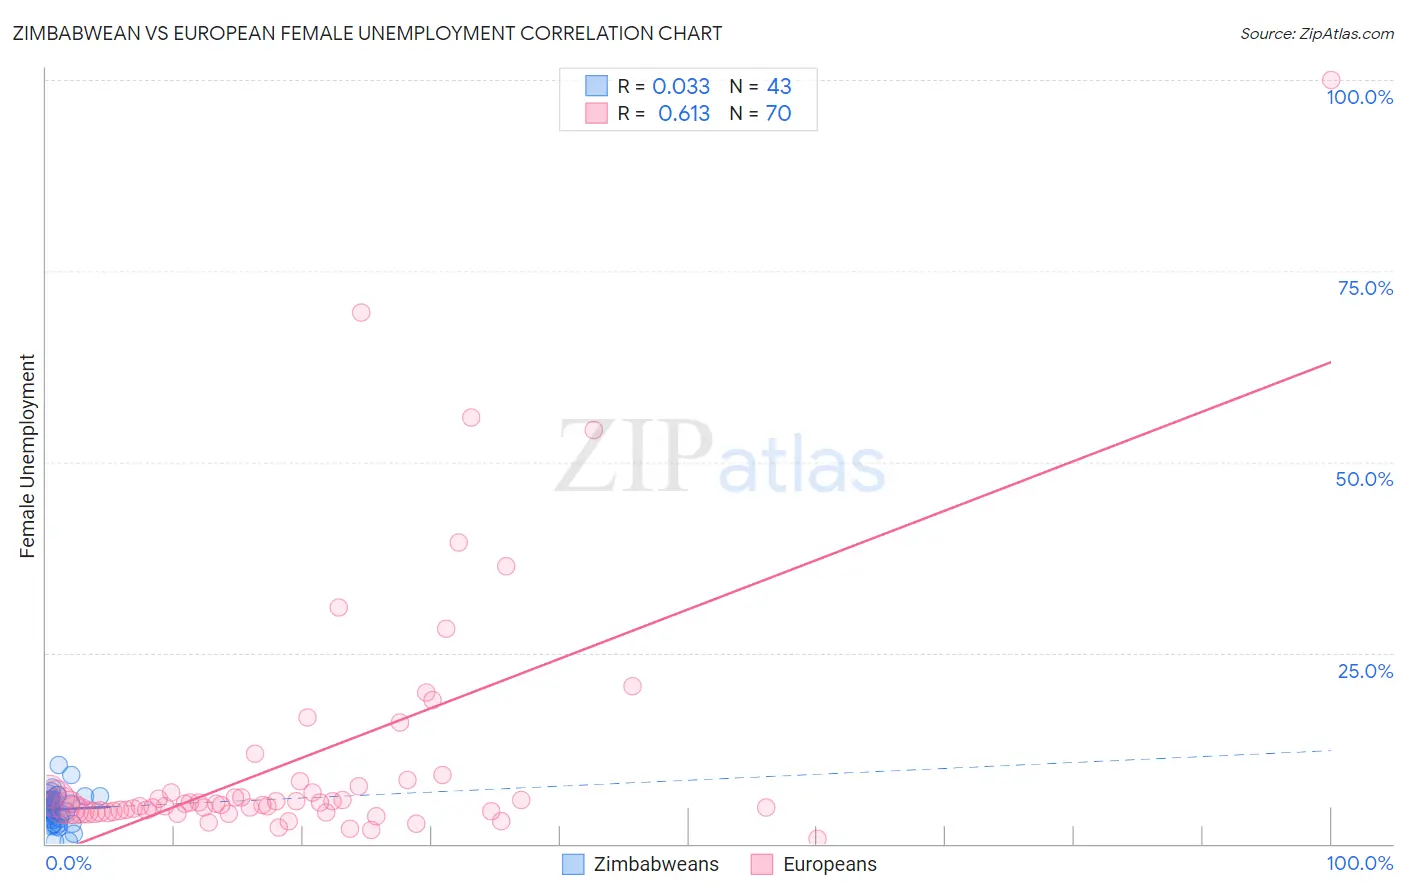
Zimbabwean vs European Female Unemployment Correlation Chart
The statistical analysis conducted on geographies consisting of 69,190,722 people shows no correlation between the proportion of Zimbabweans and unemploymnet rate among females in the United States with a correlation coefficient (R) of 0.033 and weighted average of 4.8%. Similarly, the statistical analysis conducted on geographies consisting of 549,789,782 people shows a significant positive correlation between the proportion of Europeans and unemploymnet rate among females in the United States with a correlation coefficient (R) of 0.613 and weighted average of 4.7%, a difference of 2.2%.
Female Unemployment Correlation Summary
| Measurement | Zimbabwean | European |
| Minimum | 0.30% | 0.60% |
| Maximum | 10.3% | 100.0% |
| Range | 10.0% | 99.4% |
| Mean | 4.5% | 11.3% |
| Median | 4.5% | 5.2% |
| Interquartile 25% (IQ1) | 3.1% | 4.3% |
| Interquartile 75% (IQ3) | 5.7% | 7.6% |
| Interquartile Range (IQR) | 2.6% | 3.3% |
| Standard Deviation (Sample) | 2.0% | 17.0% |
| Standard Deviation (Population) | 2.0% | 16.9% |
Demographics Similar to Zimbabweans and Europeans by Female Unemployment
In terms of female unemployment, the demographic groups most similar to Zimbabweans are Czechoslovakian (4.8%, a difference of 0.030%), French Canadian (4.8%, a difference of 0.060%), Yugoslavian (4.8%, a difference of 0.21%), Slovak (4.8%, a difference of 0.54%), and Pennsylvania German (4.8%, a difference of 0.57%). Similarly, the demographic groups most similar to Europeans are Fijian (4.7%, a difference of 0.020%), Bulgarian (4.7%, a difference of 0.030%), Polish (4.7%, a difference of 0.11%), Latvian (4.7%, a difference of 0.12%), and Scottish (4.7%, a difference of 0.55%).
| Demographics | Rating | Rank | Female Unemployment |
| Latvians | 99.9 /100 | #18 | Exceptional 4.7% |
| Poles | 99.9 /100 | #19 | Exceptional 4.7% |
| Bulgarians | 99.9 /100 | #20 | Exceptional 4.7% |
| Fijians | 99.9 /100 | #21 | Exceptional 4.7% |
| Europeans | 99.9 /100 | #22 | Exceptional 4.7% |
| Scottish | 99.9 /100 | #23 | Exceptional 4.7% |
| Welsh | 99.9 /100 | #24 | Exceptional 4.7% |
| Immigrants | India | 99.9 /100 | #25 | Exceptional 4.7% |
| Immigrants | Bosnia and Herzegovina | 99.9 /100 | #26 | Exceptional 4.7% |
| British | 99.9 /100 | #27 | Exceptional 4.7% |
| Irish | 99.9 /100 | #28 | Exceptional 4.7% |
| Cypriots | 99.9 /100 | #29 | Exceptional 4.7% |
| Lithuanians | 99.8 /100 | #30 | Exceptional 4.7% |
| Sudanese | 99.8 /100 | #31 | Exceptional 4.8% |
| Slovaks | 99.8 /100 | #32 | Exceptional 4.8% |
| Czechoslovakians | 99.7 /100 | #33 | Exceptional 4.8% |
| Zimbabweans | 99.7 /100 | #34 | Exceptional 4.8% |
| French Canadians | 99.7 /100 | #35 | Exceptional 4.8% |
| Yugoslavians | 99.7 /100 | #36 | Exceptional 4.8% |
| Pennsylvania Germans | 99.6 /100 | #37 | Exceptional 4.8% |
| Northern Europeans | 99.6 /100 | #38 | Exceptional 4.8% |