Zimbabwean vs Immigrants from Eastern Africa Male Unemployment
COMPARE
Zimbabwean
Immigrants from Eastern Africa
Male Unemployment
Male Unemployment Comparison
Zimbabweans
Immigrants from Eastern Africa
4.8%
MALE UNEMPLOYMENT
99.9/ 100
METRIC RATING
25th/ 347
METRIC RANK
5.2%
MALE UNEMPLOYMENT
79.8/ 100
METRIC RATING
137th/ 347
METRIC RANK
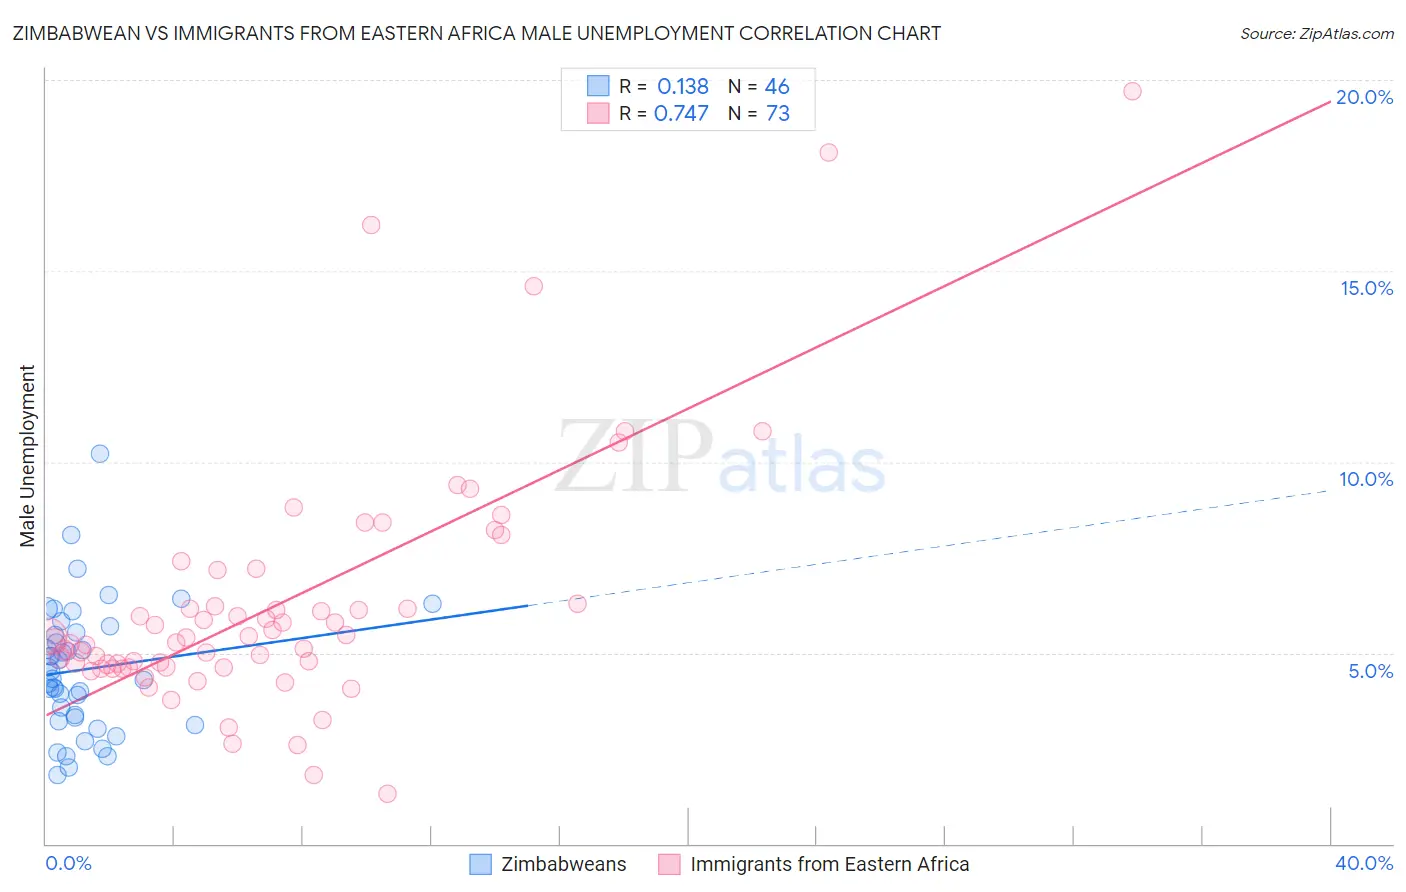
Zimbabwean vs Immigrants from Eastern Africa Male Unemployment Correlation Chart
The statistical analysis conducted on geographies consisting of 69,161,381 people shows a poor positive correlation between the proportion of Zimbabweans and unemployment rate among males in the United States with a correlation coefficient (R) of 0.138 and weighted average of 4.8%. Similarly, the statistical analysis conducted on geographies consisting of 354,168,433 people shows a strong positive correlation between the proportion of Immigrants from Eastern Africa and unemployment rate among males in the United States with a correlation coefficient (R) of 0.747 and weighted average of 5.2%, a difference of 8.6%.
Male Unemployment Correlation Summary
| Measurement | Zimbabwean | Immigrants from Eastern Africa |
| Minimum | 1.8% | 1.3% |
| Maximum | 10.2% | 19.7% |
| Range | 8.4% | 18.4% |
| Mean | 4.6% | 6.3% |
| Median | 4.4% | 5.4% |
| Interquartile 25% (IQ1) | 3.3% | 4.6% |
| Interquartile 75% (IQ3) | 5.5% | 6.7% |
| Interquartile Range (IQR) | 2.2% | 2.1% |
| Standard Deviation (Sample) | 1.7% | 3.3% |
| Standard Deviation (Population) | 1.7% | 3.2% |
Similar Demographics by Male Unemployment
Demographics Similar to Zimbabweans by Male Unemployment
In terms of male unemployment, the demographic groups most similar to Zimbabweans are Dutch (4.8%, a difference of 0.020%), Immigrants from South Central Asia (4.8%, a difference of 0.10%), Tongan (4.8%, a difference of 0.13%), Carpatho Rusyn (4.8%, a difference of 0.18%), and Immigrants from Taiwan (4.8%, a difference of 0.19%).
| Demographics | Rating | Rank | Male Unemployment |
| English | 99.9 /100 | #18 | Exceptional 4.8% |
| Europeans | 99.9 /100 | #19 | Exceptional 4.8% |
| Pennsylvania Germans | 99.9 /100 | #20 | Exceptional 4.8% |
| Immigrants | Taiwan | 99.9 /100 | #21 | Exceptional 4.8% |
| Carpatho Rusyns | 99.9 /100 | #22 | Exceptional 4.8% |
| Tongans | 99.9 /100 | #23 | Exceptional 4.8% |
| Immigrants | South Central Asia | 99.9 /100 | #24 | Exceptional 4.8% |
| Zimbabweans | 99.9 /100 | #25 | Exceptional 4.8% |
| Dutch | 99.9 /100 | #26 | Exceptional 4.8% |
| Belgians | 99.9 /100 | #27 | Exceptional 4.8% |
| Bulgarians | 99.8 /100 | #28 | Exceptional 4.8% |
| Scottish | 99.8 /100 | #29 | Exceptional 4.8% |
| British | 99.8 /100 | #30 | Exceptional 4.8% |
| Sudanese | 99.8 /100 | #31 | Exceptional 4.8% |
| Immigrants | Nepal | 99.8 /100 | #32 | Exceptional 4.8% |
Demographics Similar to Immigrants from Eastern Africa by Male Unemployment
In terms of male unemployment, the demographic groups most similar to Immigrants from Eastern Africa are Lebanese (5.2%, a difference of 0.010%), Immigrants from Croatia (5.2%, a difference of 0.010%), Immigrants from Saudi Arabia (5.2%, a difference of 0.030%), Kenyan (5.2%, a difference of 0.030%), and Brazilian (5.2%, a difference of 0.040%).
| Demographics | Rating | Rank | Male Unemployment |
| Immigrants | Malaysia | 83.5 /100 | #130 | Excellent 5.2% |
| Immigrants | Germany | 83.0 /100 | #131 | Excellent 5.2% |
| Chickasaw | 82.9 /100 | #132 | Excellent 5.2% |
| Colombians | 81.1 /100 | #133 | Excellent 5.2% |
| Pakistanis | 80.5 /100 | #134 | Excellent 5.2% |
| Immigrants | Saudi Arabia | 80.1 /100 | #135 | Excellent 5.2% |
| Lebanese | 79.9 /100 | #136 | Good 5.2% |
| Immigrants | Eastern Africa | 79.8 /100 | #137 | Good 5.2% |
| Immigrants | Croatia | 79.7 /100 | #138 | Good 5.2% |
| Kenyans | 79.4 /100 | #139 | Good 5.2% |
| Brazilians | 79.3 /100 | #140 | Good 5.2% |
| Immigrants | Switzerland | 79.2 /100 | #141 | Good 5.2% |
| Fijians | 78.3 /100 | #142 | Good 5.2% |
| Syrians | 78.0 /100 | #143 | Good 5.2% |
| Sri Lankans | 77.9 /100 | #144 | Good 5.2% |