Zimbabwean vs French American Indian Male Unemployment
COMPARE
Zimbabwean
French American Indian
Male Unemployment
Male Unemployment Comparison
Zimbabweans
French American Indians
4.8%
MALE UNEMPLOYMENT
99.9/ 100
METRIC RATING
25th/ 347
METRIC RANK
5.9%
MALE UNEMPLOYMENT
0.0/ 100
METRIC RATING
265th/ 347
METRIC RANK
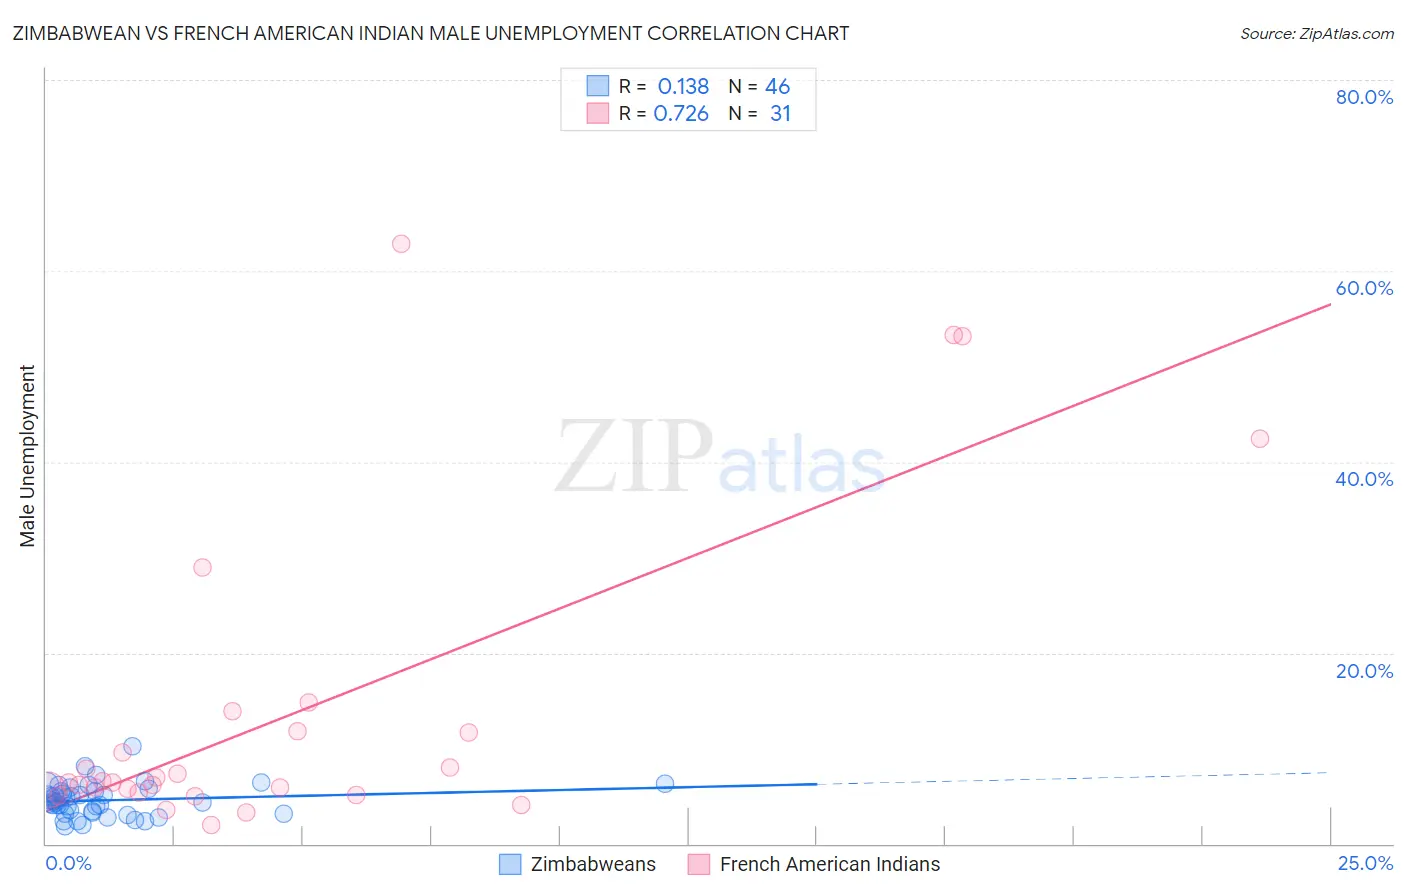
Zimbabwean vs French American Indian Male Unemployment Correlation Chart
The statistical analysis conducted on geographies consisting of 69,161,381 people shows a poor positive correlation between the proportion of Zimbabweans and unemployment rate among males in the United States with a correlation coefficient (R) of 0.138 and weighted average of 4.8%. Similarly, the statistical analysis conducted on geographies consisting of 131,648,620 people shows a strong positive correlation between the proportion of French American Indians and unemployment rate among males in the United States with a correlation coefficient (R) of 0.726 and weighted average of 5.9%, a difference of 23.7%.
Male Unemployment Correlation Summary
| Measurement | Zimbabwean | French American Indian |
| Minimum | 1.8% | 1.9% |
| Maximum | 10.2% | 62.9% |
| Range | 8.4% | 61.0% |
| Mean | 4.6% | 13.6% |
| Median | 4.4% | 6.4% |
| Interquartile 25% (IQ1) | 3.3% | 5.4% |
| Interquartile 75% (IQ3) | 5.5% | 11.8% |
| Interquartile Range (IQR) | 2.2% | 6.4% |
| Standard Deviation (Sample) | 1.7% | 16.4% |
| Standard Deviation (Population) | 1.7% | 16.1% |
Similar Demographics by Male Unemployment
Demographics Similar to Zimbabweans by Male Unemployment
In terms of male unemployment, the demographic groups most similar to Zimbabweans are Dutch (4.8%, a difference of 0.020%), Immigrants from South Central Asia (4.8%, a difference of 0.10%), Tongan (4.8%, a difference of 0.13%), Carpatho Rusyn (4.8%, a difference of 0.18%), and Immigrants from Taiwan (4.8%, a difference of 0.19%).
| Demographics | Rating | Rank | Male Unemployment |
| English | 99.9 /100 | #18 | Exceptional 4.8% |
| Europeans | 99.9 /100 | #19 | Exceptional 4.8% |
| Pennsylvania Germans | 99.9 /100 | #20 | Exceptional 4.8% |
| Immigrants | Taiwan | 99.9 /100 | #21 | Exceptional 4.8% |
| Carpatho Rusyns | 99.9 /100 | #22 | Exceptional 4.8% |
| Tongans | 99.9 /100 | #23 | Exceptional 4.8% |
| Immigrants | South Central Asia | 99.9 /100 | #24 | Exceptional 4.8% |
| Zimbabweans | 99.9 /100 | #25 | Exceptional 4.8% |
| Dutch | 99.9 /100 | #26 | Exceptional 4.8% |
| Belgians | 99.9 /100 | #27 | Exceptional 4.8% |
| Bulgarians | 99.8 /100 | #28 | Exceptional 4.8% |
| Scottish | 99.8 /100 | #29 | Exceptional 4.8% |
| British | 99.8 /100 | #30 | Exceptional 4.8% |
| Sudanese | 99.8 /100 | #31 | Exceptional 4.8% |
| Immigrants | Nepal | 99.8 /100 | #32 | Exceptional 4.8% |
Demographics Similar to French American Indians by Male Unemployment
In terms of male unemployment, the demographic groups most similar to French American Indians are Bahamian (5.9%, a difference of 0.14%), Nigerian (5.9%, a difference of 0.26%), Immigrants from Mexico (5.9%, a difference of 0.39%), Bermudan (5.9%, a difference of 0.47%), and Immigrants from Latin America (5.9%, a difference of 0.61%).
| Demographics | Rating | Rank | Male Unemployment |
| Dutch West Indians | 0.1 /100 | #258 | Tragic 5.8% |
| Cajuns | 0.1 /100 | #259 | Tragic 5.8% |
| Immigrants | Central America | 0.1 /100 | #260 | Tragic 5.8% |
| Liberians | 0.1 /100 | #261 | Tragic 5.8% |
| Immigrants | Portugal | 0.1 /100 | #262 | Tragic 5.9% |
| Immigrants | Latin America | 0.1 /100 | #263 | Tragic 5.9% |
| Immigrants | Mexico | 0.0 /100 | #264 | Tragic 5.9% |
| French American Indians | 0.0 /100 | #265 | Tragic 5.9% |
| Bahamians | 0.0 /100 | #266 | Tragic 5.9% |
| Nigerians | 0.0 /100 | #267 | Tragic 5.9% |
| Bermudans | 0.0 /100 | #268 | Tragic 5.9% |
| Immigrants | Nigeria | 0.0 /100 | #269 | Tragic 6.0% |
| Sub-Saharan Africans | 0.0 /100 | #270 | Tragic 6.0% |
| Blackfeet | 0.0 /100 | #271 | Tragic 6.0% |
| Immigrants | Uzbekistan | 0.0 /100 | #272 | Tragic 6.0% |