Yup'ik vs Tsimshian Unemployment
COMPARE
Yup'ik
Tsimshian
Unemployment
Unemployment Comparison
Yup'ik
Tsimshian
13.6%
UNEMPLOYMENT
0.0/ 100
METRIC RATING
347th/ 347
METRIC RANK
7.2%
UNEMPLOYMENT
0.0/ 100
METRIC RATING
328th/ 347
METRIC RANK
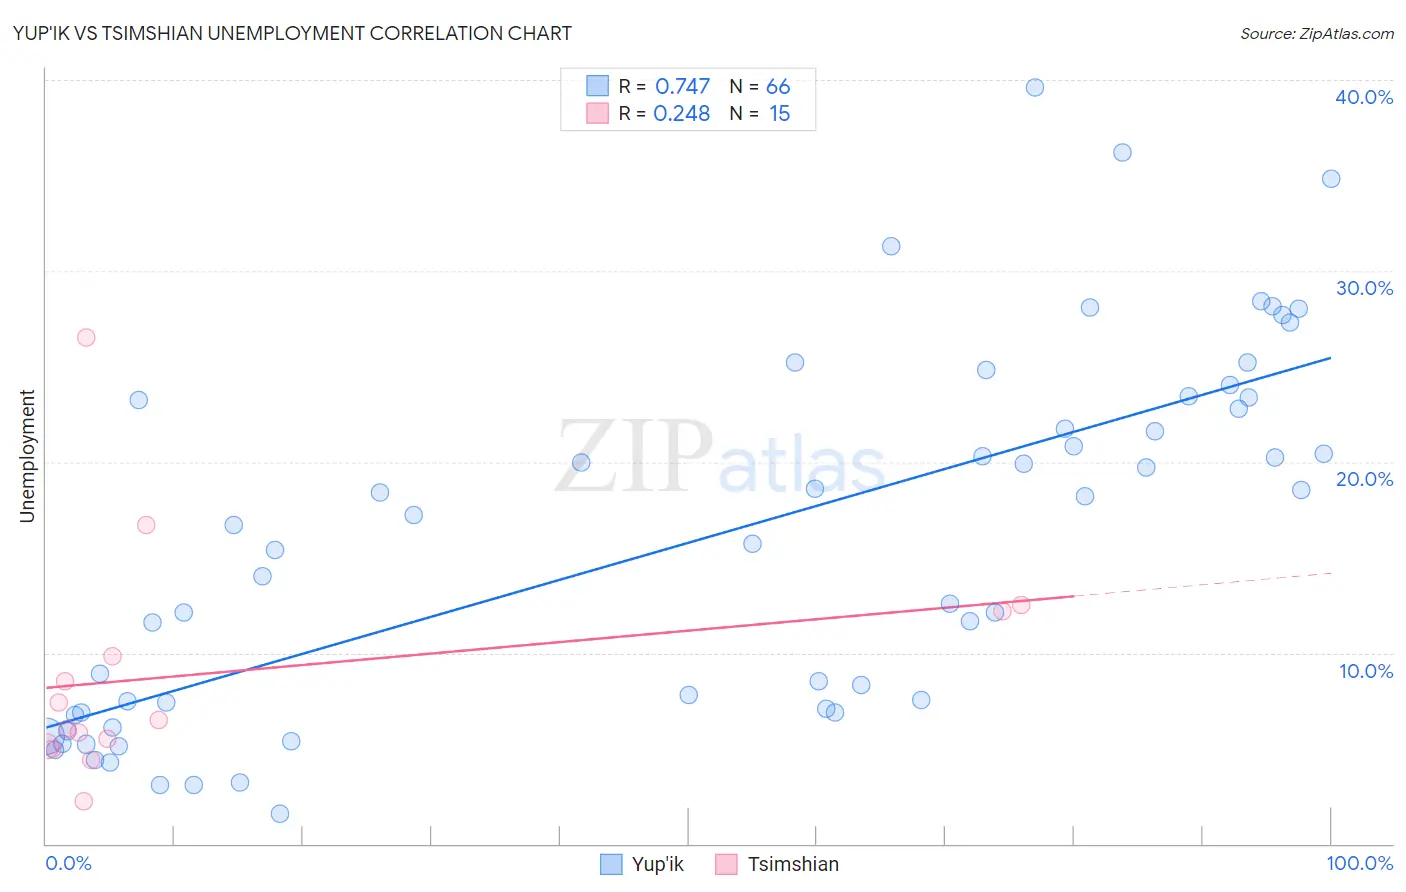
Yup'ik vs Tsimshian Unemployment Correlation Chart
The statistical analysis conducted on geographies consisting of 39,958,223 people shows a strong positive correlation between the proportion of Yup'ik and unemployment in the United States with a correlation coefficient (R) of 0.747 and weighted average of 13.6%. Similarly, the statistical analysis conducted on geographies consisting of 15,625,029 people shows a weak positive correlation between the proportion of Tsimshian and unemployment in the United States with a correlation coefficient (R) of 0.248 and weighted average of 7.2%, a difference of 89.0%.
Unemployment Correlation Summary
| Measurement | Yup'ik | Tsimshian |
| Minimum | 1.6% | 2.2% |
| Maximum | 39.6% | 26.5% |
| Range | 38.0% | 24.3% |
| Mean | 15.8% | 8.9% |
| Median | 16.2% | 6.5% |
| Interquartile 25% (IQ1) | 6.9% | 5.1% |
| Interquartile 75% (IQ3) | 23.2% | 12.2% |
| Interquartile Range (IQR) | 16.3% | 7.1% |
| Standard Deviation (Sample) | 9.5% | 6.1% |
| Standard Deviation (Population) | 9.4% | 5.9% |
Demographics Similar to Yup'ik and Tsimshian by Unemployment
In terms of unemployment, the demographic groups most similar to Yup'ik are Crow (11.1%, a difference of 23.3%), Inupiat (10.1%, a difference of 34.8%), Arapaho (9.8%, a difference of 38.8%), Yuman (9.1%, a difference of 50.4%), and Hopi (8.9%, a difference of 53.0%). Similarly, the demographic groups most similar to Tsimshian are Alaska Native (7.2%, a difference of 0.31%), Pueblo (7.2%, a difference of 0.91%), Yakama (7.3%, a difference of 1.6%), Dominican (7.4%, a difference of 1.9%), and Sioux (7.4%, a difference of 2.4%).
| Demographics | Rating | Rank | Unemployment |
| Pueblo | 0.0 /100 | #327 | Tragic 7.2% |
| Tsimshian | 0.0 /100 | #328 | Tragic 7.2% |
| Alaska Natives | 0.0 /100 | #329 | Tragic 7.2% |
| Yakama | 0.0 /100 | #330 | Tragic 7.3% |
| Dominicans | 0.0 /100 | #331 | Tragic 7.4% |
| Sioux | 0.0 /100 | #332 | Tragic 7.4% |
| Immigrants | Dominican Republic | 0.0 /100 | #333 | Tragic 7.4% |
| Apache | 0.0 /100 | #334 | Tragic 7.4% |
| Alaskan Athabascans | 0.0 /100 | #335 | Tragic 7.7% |
| Immigrants | Yemen | 0.0 /100 | #336 | Tragic 7.7% |
| Cheyenne | 0.0 /100 | #337 | Tragic 8.0% |
| Pima | 0.0 /100 | #338 | Tragic 8.2% |
| Navajo | 0.0 /100 | #339 | Tragic 8.4% |
| Puerto Ricans | 0.0 /100 | #340 | Tragic 8.4% |
| Tohono O'odham | 0.0 /100 | #341 | Tragic 8.9% |
| Hopi | 0.0 /100 | #342 | Tragic 8.9% |
| Yuman | 0.0 /100 | #343 | Tragic 9.1% |
| Arapaho | 0.0 /100 | #344 | Tragic 9.8% |
| Inupiat | 0.0 /100 | #345 | Tragic 10.1% |
| Crow | 0.0 /100 | #346 | Tragic 11.1% |
| Yup'ik | 0.0 /100 | #347 | Tragic 13.6% |