Russian vs Tsimshian Unemployment
COMPARE
Russian
Tsimshian
Unemployment
Unemployment Comparison
Russians
Tsimshian
5.0%
UNEMPLOYMENT
97.4/ 100
METRIC RATING
84th/ 347
METRIC RANK
7.2%
UNEMPLOYMENT
0.0/ 100
METRIC RATING
328th/ 347
METRIC RANK
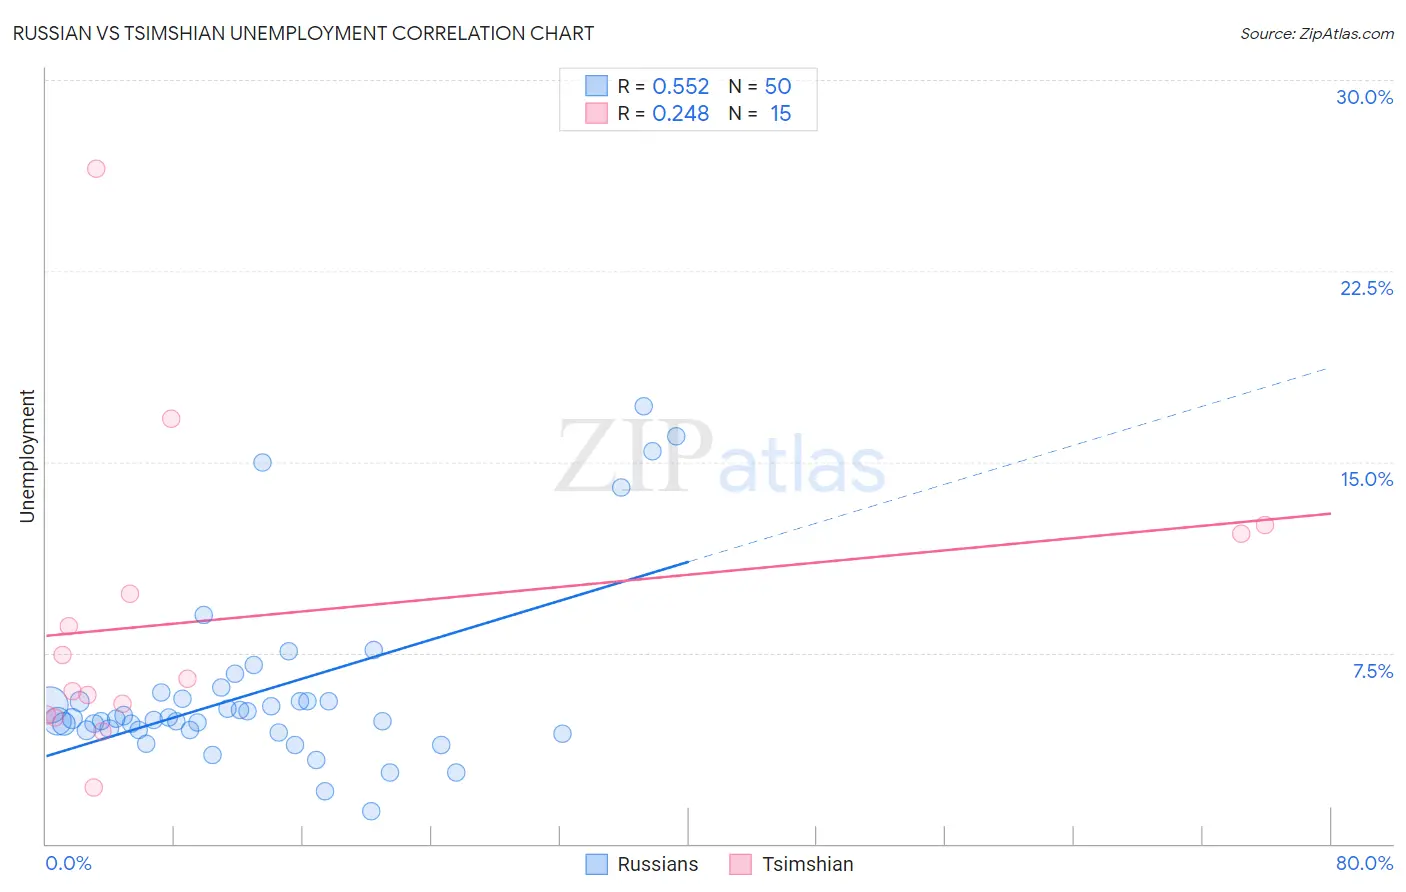
Russian vs Tsimshian Unemployment Correlation Chart
The statistical analysis conducted on geographies consisting of 510,522,932 people shows a substantial positive correlation between the proportion of Russians and unemployment in the United States with a correlation coefficient (R) of 0.552 and weighted average of 5.0%. Similarly, the statistical analysis conducted on geographies consisting of 15,625,029 people shows a weak positive correlation between the proportion of Tsimshian and unemployment in the United States with a correlation coefficient (R) of 0.248 and weighted average of 7.2%, a difference of 45.4%.
Unemployment Correlation Summary
| Measurement | Russian | Tsimshian |
| Minimum | 1.3% | 2.2% |
| Maximum | 17.2% | 26.5% |
| Range | 15.9% | 24.3% |
| Mean | 6.0% | 8.9% |
| Median | 4.9% | 6.5% |
| Interquartile 25% (IQ1) | 4.5% | 5.1% |
| Interquartile 75% (IQ3) | 5.7% | 12.2% |
| Interquartile Range (IQR) | 1.2% | 7.1% |
| Standard Deviation (Sample) | 3.5% | 6.1% |
| Standard Deviation (Population) | 3.4% | 5.9% |
Similar Demographics by Unemployment
Demographics Similar to Russians by Unemployment
In terms of unemployment, the demographic groups most similar to Russians are Hmong (5.0%, a difference of 0.080%), Fijian (5.0%, a difference of 0.090%), Basque (5.0%, a difference of 0.10%), Immigrants from Sweden (5.0%, a difference of 0.11%), and Canadian (5.0%, a difference of 0.18%).
| Demographics | Rating | Rank | Unemployment |
| Cypriots | 97.9 /100 | #77 | Exceptional 4.9% |
| Okinawans | 97.9 /100 | #78 | Exceptional 4.9% |
| Canadians | 97.7 /100 | #79 | Exceptional 5.0% |
| Immigrants | Sweden | 97.6 /100 | #80 | Exceptional 5.0% |
| Basques | 97.6 /100 | #81 | Exceptional 5.0% |
| Fijians | 97.6 /100 | #82 | Exceptional 5.0% |
| Hmong | 97.6 /100 | #83 | Exceptional 5.0% |
| Russians | 97.4 /100 | #84 | Exceptional 5.0% |
| Immigrants | Australia | 97.0 /100 | #85 | Exceptional 5.0% |
| Hungarians | 96.9 /100 | #86 | Exceptional 5.0% |
| Immigrants | Moldova | 96.6 /100 | #87 | Exceptional 5.0% |
| Immigrants | Korea | 96.6 /100 | #88 | Exceptional 5.0% |
| Jordanians | 96.4 /100 | #89 | Exceptional 5.0% |
| Immigrants | North Macedonia | 96.3 /100 | #90 | Exceptional 5.0% |
| Immigrants | Sudan | 96.3 /100 | #91 | Exceptional 5.0% |
Demographics Similar to Tsimshian by Unemployment
In terms of unemployment, the demographic groups most similar to Tsimshian are Alaska Native (7.2%, a difference of 0.31%), Pueblo (7.2%, a difference of 0.91%), Paiute (7.1%, a difference of 1.4%), Yakama (7.3%, a difference of 1.6%), and Dominican (7.4%, a difference of 1.9%).
| Demographics | Rating | Rank | Unemployment |
| Immigrants | Guyana | 0.0 /100 | #321 | Tragic 6.9% |
| Guyanese | 0.0 /100 | #322 | Tragic 6.9% |
| Immigrants | Grenada | 0.0 /100 | #323 | Tragic 6.9% |
| Immigrants | Armenia | 0.0 /100 | #324 | Tragic 7.0% |
| Natives/Alaskans | 0.0 /100 | #325 | Tragic 7.0% |
| Paiute | 0.0 /100 | #326 | Tragic 7.1% |
| Pueblo | 0.0 /100 | #327 | Tragic 7.2% |
| Tsimshian | 0.0 /100 | #328 | Tragic 7.2% |
| Alaska Natives | 0.0 /100 | #329 | Tragic 7.2% |
| Yakama | 0.0 /100 | #330 | Tragic 7.3% |
| Dominicans | 0.0 /100 | #331 | Tragic 7.4% |
| Sioux | 0.0 /100 | #332 | Tragic 7.4% |
| Immigrants | Dominican Republic | 0.0 /100 | #333 | Tragic 7.4% |
| Apache | 0.0 /100 | #334 | Tragic 7.4% |
| Alaskan Athabascans | 0.0 /100 | #335 | Tragic 7.7% |