Sioux vs Tsimshian Unemployment
COMPARE
Sioux
Tsimshian
Unemployment
Unemployment Comparison
Sioux
Tsimshian
7.4%
UNEMPLOYMENT
0.0/ 100
METRIC RATING
332nd/ 347
METRIC RANK
7.2%
UNEMPLOYMENT
0.0/ 100
METRIC RATING
328th/ 347
METRIC RANK
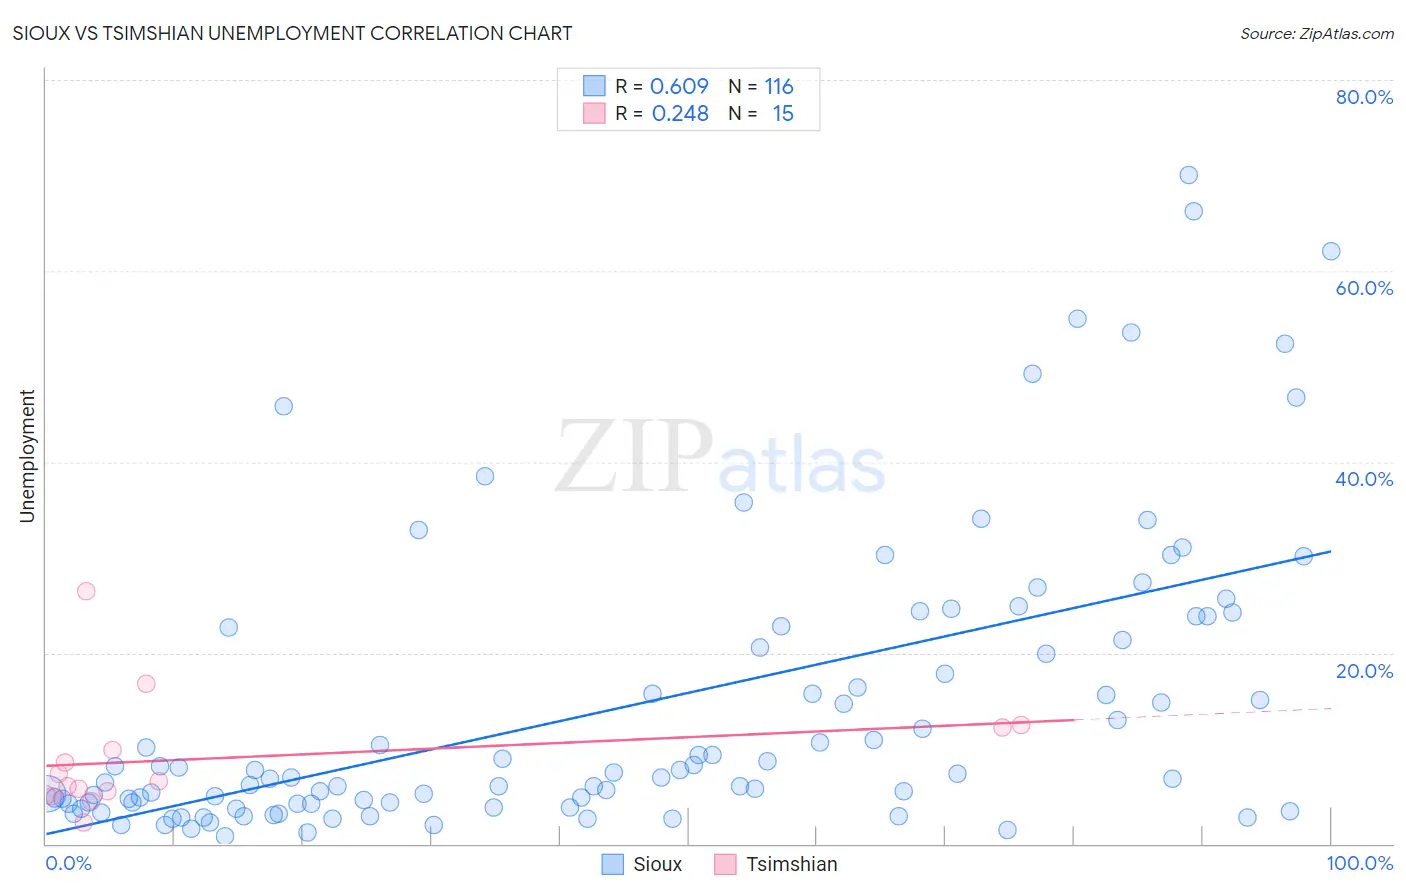
Sioux vs Tsimshian Unemployment Correlation Chart
The statistical analysis conducted on geographies consisting of 233,819,220 people shows a significant positive correlation between the proportion of Sioux and unemployment in the United States with a correlation coefficient (R) of 0.609 and weighted average of 7.4%. Similarly, the statistical analysis conducted on geographies consisting of 15,625,029 people shows a weak positive correlation between the proportion of Tsimshian and unemployment in the United States with a correlation coefficient (R) of 0.248 and weighted average of 7.2%, a difference of 2.4%.
Unemployment Correlation Summary
| Measurement | Sioux | Tsimshian |
| Minimum | 0.80% | 2.2% |
| Maximum | 70.0% | 26.5% |
| Range | 69.2% | 24.3% |
| Mean | 14.3% | 8.9% |
| Median | 7.1% | 6.5% |
| Interquartile 25% (IQ1) | 4.2% | 5.1% |
| Interquartile 75% (IQ3) | 22.0% | 12.2% |
| Interquartile Range (IQR) | 17.8% | 7.1% |
| Standard Deviation (Sample) | 15.4% | 6.1% |
| Standard Deviation (Population) | 15.3% | 5.9% |
Demographics Similar to Sioux and Tsimshian by Unemployment
In terms of unemployment, the demographic groups most similar to Sioux are Immigrants from Dominican Republic (7.4%, a difference of 0.060%), Dominican (7.4%, a difference of 0.42%), Apache (7.4%, a difference of 0.53%), Yakama (7.3%, a difference of 0.76%), and Alaska Native (7.2%, a difference of 2.1%). Similarly, the demographic groups most similar to Tsimshian are Alaska Native (7.2%, a difference of 0.31%), Pueblo (7.2%, a difference of 0.91%), Paiute (7.1%, a difference of 1.4%), Yakama (7.3%, a difference of 1.6%), and Dominican (7.4%, a difference of 1.9%).
| Demographics | Rating | Rank | Unemployment |
| Immigrants | St. Vincent and the Grenadines | 0.0 /100 | #320 | Tragic 6.9% |
| Immigrants | Guyana | 0.0 /100 | #321 | Tragic 6.9% |
| Guyanese | 0.0 /100 | #322 | Tragic 6.9% |
| Immigrants | Grenada | 0.0 /100 | #323 | Tragic 6.9% |
| Immigrants | Armenia | 0.0 /100 | #324 | Tragic 7.0% |
| Natives/Alaskans | 0.0 /100 | #325 | Tragic 7.0% |
| Paiute | 0.0 /100 | #326 | Tragic 7.1% |
| Pueblo | 0.0 /100 | #327 | Tragic 7.2% |
| Tsimshian | 0.0 /100 | #328 | Tragic 7.2% |
| Alaska Natives | 0.0 /100 | #329 | Tragic 7.2% |
| Yakama | 0.0 /100 | #330 | Tragic 7.3% |
| Dominicans | 0.0 /100 | #331 | Tragic 7.4% |
| Sioux | 0.0 /100 | #332 | Tragic 7.4% |
| Immigrants | Dominican Republic | 0.0 /100 | #333 | Tragic 7.4% |
| Apache | 0.0 /100 | #334 | Tragic 7.4% |
| Alaskan Athabascans | 0.0 /100 | #335 | Tragic 7.7% |
| Immigrants | Yemen | 0.0 /100 | #336 | Tragic 7.7% |
| Cheyenne | 0.0 /100 | #337 | Tragic 8.0% |
| Pima | 0.0 /100 | #338 | Tragic 8.2% |
| Navajo | 0.0 /100 | #339 | Tragic 8.4% |
| Puerto Ricans | 0.0 /100 | #340 | Tragic 8.4% |