Yup'ik vs Tsimshian High School Diploma
COMPARE
Yup'ik
Tsimshian
High School Diploma
High School Diploma Comparison
Yup'ik
Tsimshian
86.1%
HIGH SCHOOL DIPLOMA
0.0/ 100
METRIC RATING
289th/ 347
METRIC RANK
91.3%
HIGH SCHOOL DIPLOMA
99.9/ 100
METRIC RATING
36th/ 347
METRIC RANK
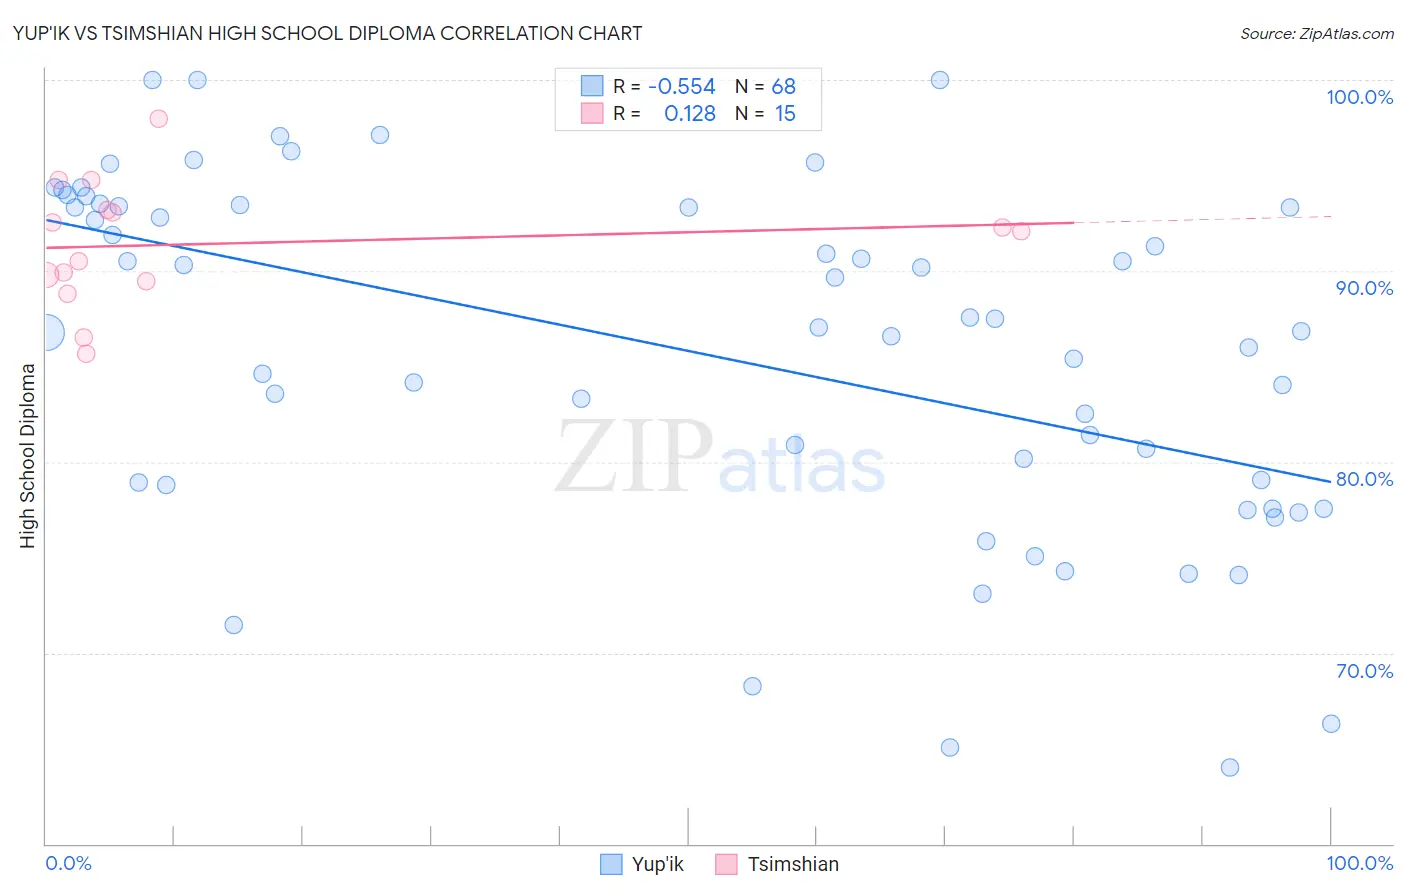
Yup'ik vs Tsimshian High School Diploma Correlation Chart
The statistical analysis conducted on geographies consisting of 39,964,654 people shows a substantial negative correlation between the proportion of Yup'ik and percentage of population with at least high school diploma education in the United States with a correlation coefficient (R) of -0.554 and weighted average of 86.1%. Similarly, the statistical analysis conducted on geographies consisting of 15,626,544 people shows a poor positive correlation between the proportion of Tsimshian and percentage of population with at least high school diploma education in the United States with a correlation coefficient (R) of 0.128 and weighted average of 91.3%, a difference of 6.1%.
High School Diploma Correlation Summary
| Measurement | Yup'ik | Tsimshian |
| Minimum | 64.0% | 85.7% |
| Maximum | 100.0% | 98.0% |
| Range | 36.0% | 12.3% |
| Mean | 85.8% | 91.4% |
| Median | 86.9% | 92.1% |
| Interquartile 25% (IQ1) | 78.9% | 89.5% |
| Interquartile 75% (IQ3) | 93.4% | 93.2% |
| Interquartile Range (IQR) | 14.5% | 3.8% |
| Standard Deviation (Sample) | 9.1% | 3.2% |
| Standard Deviation (Population) | 9.0% | 3.1% |
Similar Demographics by High School Diploma
Demographics Similar to Yup'ik by High School Diploma
In terms of high school diploma, the demographic groups most similar to Yup'ik are Fijian (86.0%, a difference of 0.070%), Immigrants from Vietnam (86.2%, a difference of 0.11%), Ute (86.2%, a difference of 0.12%), Immigrants from St. Vincent and the Grenadines (86.2%, a difference of 0.15%), and Immigrants from West Indies (86.2%, a difference of 0.17%).
| Demographics | Rating | Rank | High School Diploma |
| Dutch West Indians | 0.0 /100 | #282 | Tragic 86.5% |
| Immigrants | Barbados | 0.0 /100 | #283 | Tragic 86.4% |
| Paiute | 0.0 /100 | #284 | Tragic 86.4% |
| Immigrants | West Indies | 0.0 /100 | #285 | Tragic 86.2% |
| Immigrants | St. Vincent and the Grenadines | 0.0 /100 | #286 | Tragic 86.2% |
| Ute | 0.0 /100 | #287 | Tragic 86.2% |
| Immigrants | Vietnam | 0.0 /100 | #288 | Tragic 86.2% |
| Yup'ik | 0.0 /100 | #289 | Tragic 86.1% |
| Fijians | 0.0 /100 | #290 | Tragic 86.0% |
| Haitians | 0.0 /100 | #291 | Tragic 85.9% |
| Japanese | 0.0 /100 | #292 | Tragic 85.9% |
| British West Indians | 0.0 /100 | #293 | Tragic 85.9% |
| Immigrants | Fiji | 0.0 /100 | #294 | Tragic 85.8% |
| Immigrants | Immigrants | 0.0 /100 | #295 | Tragic 85.8% |
| Immigrants | Cambodia | 0.0 /100 | #296 | Tragic 85.6% |
Demographics Similar to Tsimshian by High School Diploma
In terms of high school diploma, the demographic groups most similar to Tsimshian are Immigrants from Ireland (91.3%, a difference of 0.020%), Irish (91.4%, a difference of 0.030%), Immigrants from Scotland (91.3%, a difference of 0.040%), Dutch (91.3%, a difference of 0.050%), and Okinawan (91.4%, a difference of 0.060%).
| Demographics | Rating | Rank | High School Diploma |
| Europeans | 99.9 /100 | #29 | Exceptional 91.4% |
| Iranians | 99.9 /100 | #30 | Exceptional 91.4% |
| Immigrants | Northern Europe | 99.9 /100 | #31 | Exceptional 91.4% |
| English | 99.9 /100 | #32 | Exceptional 91.4% |
| Okinawans | 99.9 /100 | #33 | Exceptional 91.4% |
| Scottish | 99.9 /100 | #34 | Exceptional 91.4% |
| Irish | 99.9 /100 | #35 | Exceptional 91.4% |
| Tsimshian | 99.9 /100 | #36 | Exceptional 91.3% |
| Immigrants | Ireland | 99.9 /100 | #37 | Exceptional 91.3% |
| Immigrants | Scotland | 99.8 /100 | #38 | Exceptional 91.3% |
| Dutch | 99.8 /100 | #39 | Exceptional 91.3% |
| Immigrants | Lithuania | 99.8 /100 | #40 | Exceptional 91.3% |
| Immigrants | Australia | 99.8 /100 | #41 | Exceptional 91.3% |
| Northern Europeans | 99.8 /100 | #42 | Exceptional 91.3% |
| British | 99.8 /100 | #43 | Exceptional 91.3% |