Yup'ik vs Tsimshian In Labor Force | Age 45-54
COMPARE
Yup'ik
Tsimshian
In Labor Force | Age 45-54
In Labor Force | Age 45-54 Comparison
Yup'ik
Tsimshian
78.6%
IN LABOR FORCE | AGE 45-54
0.0/ 100
METRIC RATING
321st/ 347
METRIC RANK
77.4%
IN LABOR FORCE | AGE 45-54
0.0/ 100
METRIC RATING
331st/ 347
METRIC RANK
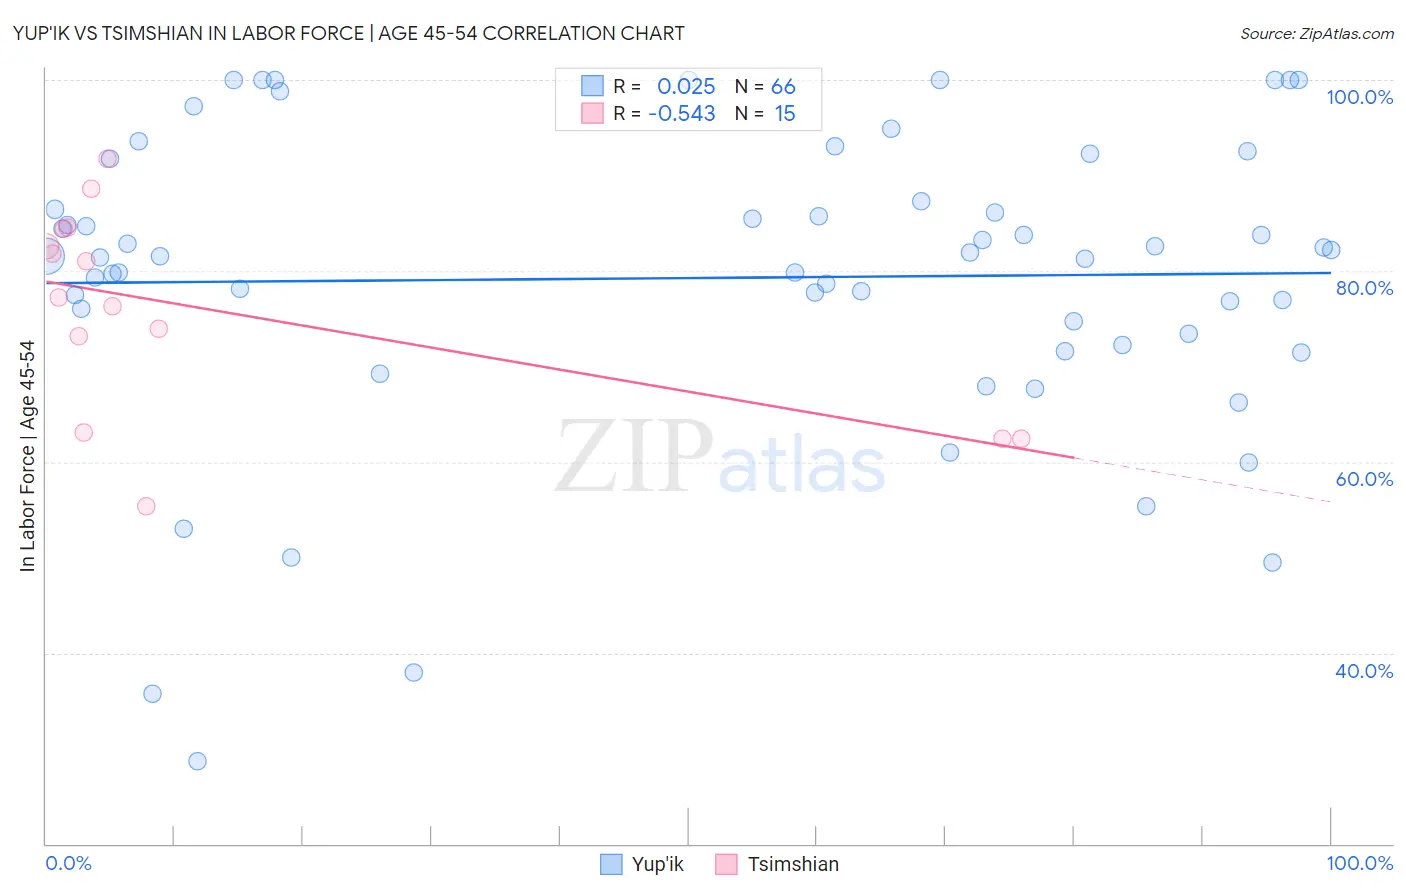
Yup'ik vs Tsimshian In Labor Force | Age 45-54 Correlation Chart
The statistical analysis conducted on geographies consisting of 39,957,049 people shows no correlation between the proportion of Yup'ik and labor force participation rate among population between the ages 45 and 54 in the United States with a correlation coefficient (R) of 0.025 and weighted average of 78.6%. Similarly, the statistical analysis conducted on geographies consisting of 15,626,261 people shows a substantial negative correlation between the proportion of Tsimshian and labor force participation rate among population between the ages 45 and 54 in the United States with a correlation coefficient (R) of -0.543 and weighted average of 77.4%, a difference of 1.6%.
In Labor Force | Age 45-54 Correlation Summary
| Measurement | Yup'ik | Tsimshian |
| Minimum | 28.6% | 55.4% |
| Maximum | 100.0% | 91.8% |
| Range | 71.4% | 36.4% |
| Mean | 79.3% | 75.9% |
| Median | 81.5% | 77.2% |
| Interquartile 25% (IQ1) | 73.5% | 63.1% |
| Interquartile 75% (IQ3) | 87.3% | 84.5% |
| Interquartile Range (IQR) | 13.8% | 21.4% |
| Standard Deviation (Sample) | 15.9% | 10.8% |
| Standard Deviation (Population) | 15.8% | 10.4% |
Demographics Similar to Yup'ik and Tsimshian by In Labor Force | Age 45-54
In terms of in labor force | age 45-54, the demographic groups most similar to Yup'ik are Yaqui (78.9%, a difference of 0.30%), Cherokee (79.0%, a difference of 0.40%), Crow (78.3%, a difference of 0.41%), Kiowa (78.3%, a difference of 0.49%), and Chickasaw (79.0%, a difference of 0.51%). Similarly, the demographic groups most similar to Tsimshian are Menominee (77.4%, a difference of 0.030%), Cheyenne (77.6%, a difference of 0.15%), Creek (77.7%, a difference of 0.37%), Native/Alaskan (77.1%, a difference of 0.39%), and Apache (77.1%, a difference of 0.39%).
| Demographics | Rating | Rank | In Labor Force | Age 45-54 |
| Shoshone | 0.0 /100 | #316 | Tragic 79.3% |
| Comanche | 0.0 /100 | #317 | Tragic 79.2% |
| Chickasaw | 0.0 /100 | #318 | Tragic 79.0% |
| Cherokee | 0.0 /100 | #319 | Tragic 79.0% |
| Yaqui | 0.0 /100 | #320 | Tragic 78.9% |
| Yup'ik | 0.0 /100 | #321 | Tragic 78.6% |
| Crow | 0.0 /100 | #322 | Tragic 78.3% |
| Kiowa | 0.0 /100 | #323 | Tragic 78.3% |
| Dutch West Indians | 0.0 /100 | #324 | Tragic 78.2% |
| Choctaw | 0.0 /100 | #325 | Tragic 78.2% |
| Seminole | 0.0 /100 | #326 | Tragic 78.1% |
| Cajuns | 0.0 /100 | #327 | Tragic 78.1% |
| Sioux | 0.0 /100 | #328 | Tragic 78.0% |
| Creek | 0.0 /100 | #329 | Tragic 77.7% |
| Cheyenne | 0.0 /100 | #330 | Tragic 77.6% |
| Tsimshian | 0.0 /100 | #331 | Tragic 77.4% |
| Menominee | 0.0 /100 | #332 | Tragic 77.4% |
| Natives/Alaskans | 0.0 /100 | #333 | Tragic 77.1% |
| Apache | 0.0 /100 | #334 | Tragic 77.1% |
| Arapaho | 0.0 /100 | #335 | Tragic 77.1% |
| Paiute | 0.0 /100 | #336 | Tragic 76.7% |