Yup'ik vs Tsimshian 10th Grade
COMPARE
Yup'ik
Tsimshian
10th Grade
10th Grade Comparison
Yup'ik
Tsimshian
93.6%
10TH GRADE
31.1/ 100
METRIC RATING
191st/ 347
METRIC RANK
95.6%
10TH GRADE
100.0/ 100
METRIC RATING
14th/ 347
METRIC RANK
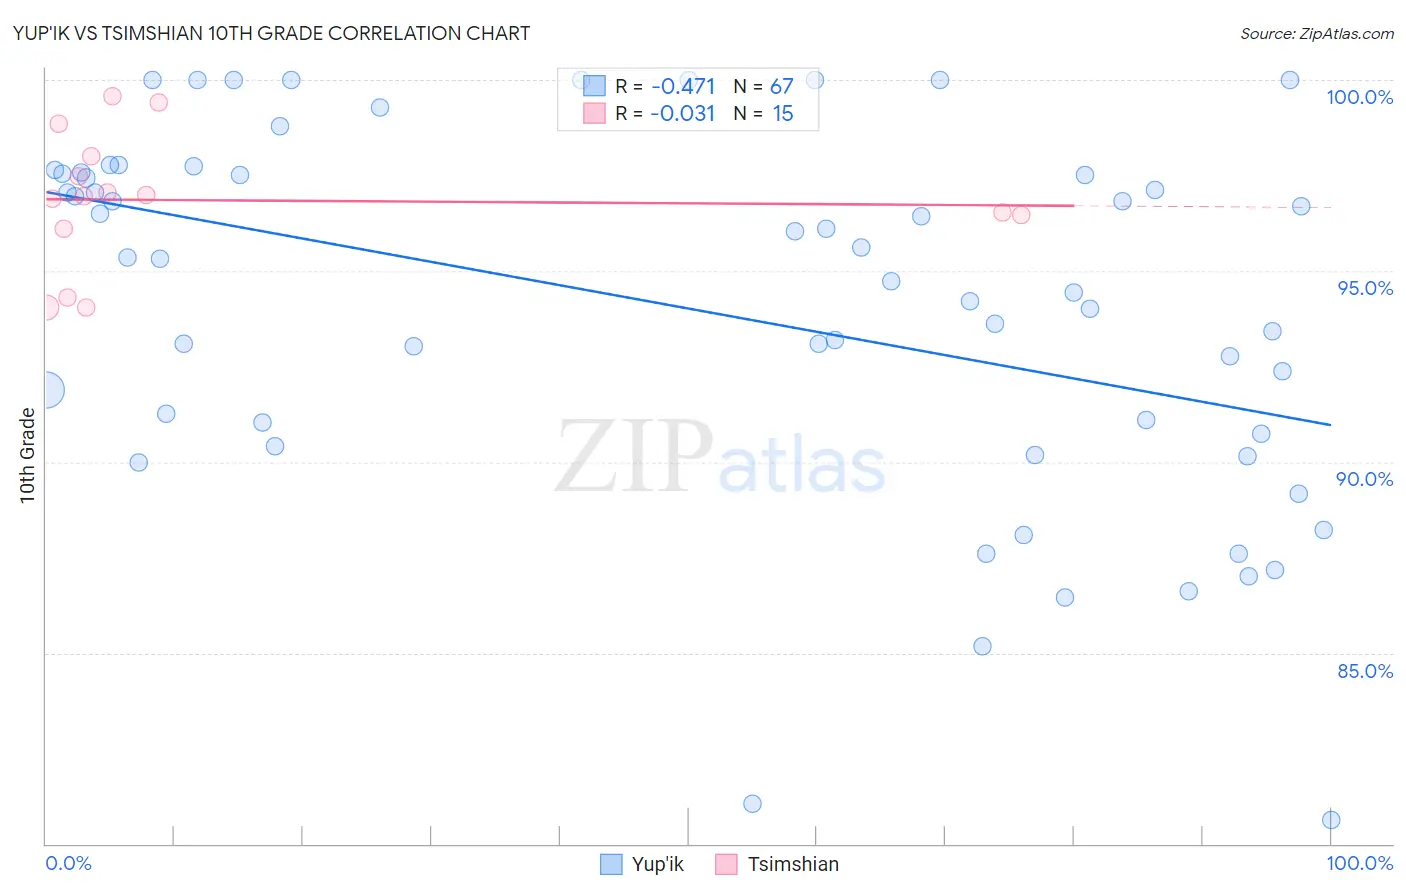
Yup'ik vs Tsimshian 10th Grade Correlation Chart
The statistical analysis conducted on geographies consisting of 39,963,824 people shows a moderate negative correlation between the proportion of Yup'ik and percentage of population with at least 10th grade education in the United States with a correlation coefficient (R) of -0.471 and weighted average of 93.6%. Similarly, the statistical analysis conducted on geographies consisting of 15,626,544 people shows no correlation between the proportion of Tsimshian and percentage of population with at least 10th grade education in the United States with a correlation coefficient (R) of -0.031 and weighted average of 95.6%, a difference of 2.2%.
10th Grade Correlation Summary
| Measurement | Yup'ik | Tsimshian |
| Minimum | 80.6% | 94.0% |
| Maximum | 100.0% | 99.6% |
| Range | 19.4% | 5.5% |
| Mean | 94.0% | 96.8% |
| Median | 95.3% | 96.9% |
| Interquartile 25% (IQ1) | 90.7% | 96.1% |
| Interquartile 75% (IQ3) | 97.6% | 98.0% |
| Interquartile Range (IQR) | 6.8% | 1.9% |
| Standard Deviation (Sample) | 4.8% | 1.7% |
| Standard Deviation (Population) | 4.7% | 1.7% |
Similar Demographics by 10th Grade
Demographics Similar to Yup'ik by 10th Grade
In terms of 10th grade, the demographic groups most similar to Yup'ik are Laotian (93.6%, a difference of 0.010%), Marshallese (93.6%, a difference of 0.020%), Immigrants from Pakistan (93.6%, a difference of 0.020%), Immigrants from Malaysia (93.5%, a difference of 0.030%), and Panamanian (93.5%, a difference of 0.030%).
| Demographics | Rating | Rank | 10th Grade |
| Choctaw | 36.6 /100 | #184 | Fair 93.6% |
| Sudanese | 36.6 /100 | #185 | Fair 93.6% |
| Immigrants | Eastern Asia | 35.1 /100 | #186 | Fair 93.6% |
| Liberians | 34.7 /100 | #187 | Fair 93.6% |
| Marshallese | 33.2 /100 | #188 | Fair 93.6% |
| Immigrants | Pakistan | 32.5 /100 | #189 | Fair 93.6% |
| Laotians | 32.1 /100 | #190 | Fair 93.6% |
| Yup'ik | 31.1 /100 | #191 | Fair 93.6% |
| Immigrants | Malaysia | 28.0 /100 | #192 | Fair 93.5% |
| Panamanians | 28.0 /100 | #193 | Fair 93.5% |
| Immigrants | Morocco | 26.9 /100 | #194 | Fair 93.5% |
| Cheyenne | 26.8 /100 | #195 | Fair 93.5% |
| Moroccans | 25.3 /100 | #196 | Fair 93.5% |
| Pueblo | 23.9 /100 | #197 | Fair 93.5% |
| Immigrants | Micronesia | 23.2 /100 | #198 | Fair 93.5% |
Demographics Similar to Tsimshian by 10th Grade
In terms of 10th grade, the demographic groups most similar to Tsimshian are English (95.6%, a difference of 0.010%), Irish (95.6%, a difference of 0.020%), Scottish (95.6%, a difference of 0.030%), Tlingit-Haida (95.7%, a difference of 0.040%), and Latvian (95.6%, a difference of 0.040%).
| Demographics | Rating | Rank | 10th Grade |
| Germans | 100.0 /100 | #7 | Exceptional 95.8% |
| Lithuanians | 100.0 /100 | #8 | Exceptional 95.8% |
| Finns | 100.0 /100 | #9 | Exceptional 95.8% |
| Croatians | 100.0 /100 | #10 | Exceptional 95.7% |
| Danes | 100.0 /100 | #11 | Exceptional 95.7% |
| Tlingit-Haida | 100.0 /100 | #12 | Exceptional 95.7% |
| English | 100.0 /100 | #13 | Exceptional 95.6% |
| Tsimshian | 100.0 /100 | #14 | Exceptional 95.6% |
| Irish | 100.0 /100 | #15 | Exceptional 95.6% |
| Scottish | 100.0 /100 | #16 | Exceptional 95.6% |
| Latvians | 100.0 /100 | #17 | Exceptional 95.6% |
| Italians | 100.0 /100 | #18 | Exceptional 95.6% |
| Scandinavians | 100.0 /100 | #19 | Exceptional 95.6% |
| Chinese | 100.0 /100 | #20 | Exceptional 95.5% |
| Dutch | 100.0 /100 | #21 | Exceptional 95.5% |