Yup'ik vs Barbadian Unemployment Among Ages 30 to 34 years
COMPARE
Yup'ik
Barbadian
Unemployment Among Ages 30 to 34 years
Unemployment Among Ages 30 to 34 years Comparison
Yup'ik
Barbadians
18.5%
UNEMPLOYMENT AMONG AGES 30 TO 34 YEARS
0.0/ 100
METRIC RATING
347th/ 347
METRIC RANK
6.5%
UNEMPLOYMENT AMONG AGES 30 TO 34 YEARS
0.0/ 100
METRIC RATING
294th/ 347
METRIC RANK
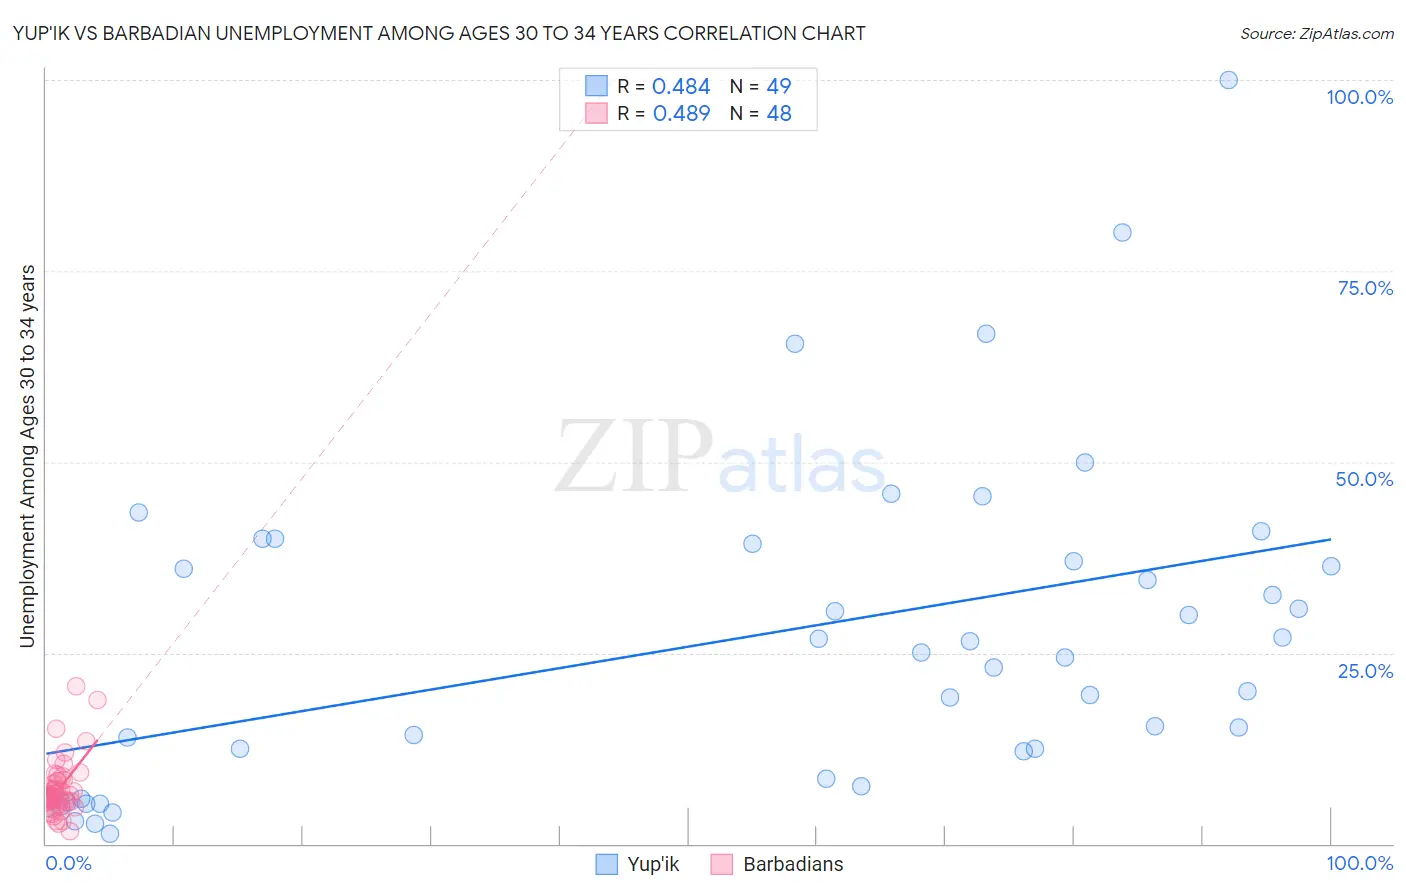
Yup'ik vs Barbadian Unemployment Among Ages 30 to 34 years Correlation Chart
The statistical analysis conducted on geographies consisting of 39,304,366 people shows a moderate positive correlation between the proportion of Yup'ik and unemployment rate among population between the ages 30 and 34 in the United States with a correlation coefficient (R) of 0.484 and weighted average of 18.5%. Similarly, the statistical analysis conducted on geographies consisting of 139,164,017 people shows a moderate positive correlation between the proportion of Barbadians and unemployment rate among population between the ages 30 and 34 in the United States with a correlation coefficient (R) of 0.489 and weighted average of 6.5%, a difference of 182.9%.
Unemployment Among Ages 30 to 34 years Correlation Summary
| Measurement | Yup'ik | Barbadian |
| Minimum | 1.3% | 1.6% |
| Maximum | 100.0% | 20.6% |
| Range | 98.7% | 19.0% |
| Mean | 26.5% | 7.2% |
| Median | 24.5% | 6.2% |
| Interquartile 25% (IQ1) | 8.1% | 5.5% |
| Interquartile 75% (IQ3) | 38.1% | 8.2% |
| Interquartile Range (IQR) | 30.1% | 2.7% |
| Standard Deviation (Sample) | 21.2% | 3.7% |
| Standard Deviation (Population) | 20.9% | 3.7% |
Similar Demographics by Unemployment Among Ages 30 to 34 years
Demographics Similar to Yup'ik by Unemployment Among Ages 30 to 34 years
In terms of unemployment among ages 30 to 34 years, the demographic groups most similar to Yup'ik are Tsimshian (13.8%, a difference of 34.2%), Arapaho (12.8%, a difference of 44.1%), Hopi (11.9%, a difference of 54.7%), Inupiat (10.8%, a difference of 70.7%), and Yuman (10.6%, a difference of 74.3%).
| Demographics | Rating | Rank | Unemployment Among Ages 30 to 34 years |
| Pueblo | 0.0 /100 | #333 | Tragic 8.3% |
| Alaska Natives | 0.0 /100 | #334 | Tragic 8.5% |
| Puerto Ricans | 0.0 /100 | #335 | Tragic 8.9% |
| Colville | 0.0 /100 | #336 | Tragic 9.0% |
| Pima | 0.0 /100 | #337 | Tragic 9.6% |
| Yakama | 0.0 /100 | #338 | Tragic 9.8% |
| Tohono O'odham | 0.0 /100 | #339 | Tragic 9.8% |
| Crow | 0.0 /100 | #340 | Tragic 10.3% |
| Navajo | 0.0 /100 | #341 | Tragic 10.6% |
| Yuman | 0.0 /100 | #342 | Tragic 10.6% |
| Inupiat | 0.0 /100 | #343 | Tragic 10.8% |
| Hopi | 0.0 /100 | #344 | Tragic 11.9% |
| Arapaho | 0.0 /100 | #345 | Tragic 12.8% |
| Tsimshian | 0.0 /100 | #346 | Tragic 13.8% |
| Yup'ik | 0.0 /100 | #347 | Tragic 18.5% |
Demographics Similar to Barbadians by Unemployment Among Ages 30 to 34 years
In terms of unemployment among ages 30 to 34 years, the demographic groups most similar to Barbadians are Trinidadian and Tobagonian (6.5%, a difference of 0.24%), Immigrants from Jamaica (6.5%, a difference of 0.29%), Creek (6.6%, a difference of 0.39%), West Indian (6.5%, a difference of 0.43%), and Vietnamese (6.5%, a difference of 0.50%).
| Demographics | Rating | Rank | Unemployment Among Ages 30 to 34 years |
| Immigrants | West Indies | 0.0 /100 | #287 | Tragic 6.4% |
| Senegalese | 0.0 /100 | #288 | Tragic 6.4% |
| Menominee | 0.0 /100 | #289 | Tragic 6.4% |
| Immigrants | Trinidad and Tobago | 0.0 /100 | #290 | Tragic 6.5% |
| Jamaicans | 0.0 /100 | #291 | Tragic 6.5% |
| Vietnamese | 0.0 /100 | #292 | Tragic 6.5% |
| West Indians | 0.0 /100 | #293 | Tragic 6.5% |
| Barbadians | 0.0 /100 | #294 | Tragic 6.5% |
| Trinidadians and Tobagonians | 0.0 /100 | #295 | Tragic 6.5% |
| Immigrants | Jamaica | 0.0 /100 | #296 | Tragic 6.5% |
| Creek | 0.0 /100 | #297 | Tragic 6.6% |
| Immigrants | Barbados | 0.0 /100 | #298 | Tragic 6.6% |
| Dutch West Indians | 0.0 /100 | #299 | Tragic 6.6% |
| Bahamians | 0.0 /100 | #300 | Tragic 6.6% |
| Belizeans | 0.0 /100 | #301 | Tragic 6.6% |