Yup'ik vs Marshallese Unemployment Among Ages 30 to 34 years
COMPARE
Yup'ik
Marshallese
Unemployment Among Ages 30 to 34 years
Unemployment Among Ages 30 to 34 years Comparison
Yup'ik
Marshallese
18.5%
UNEMPLOYMENT AMONG AGES 30 TO 34 YEARS
0.0/ 100
METRIC RATING
347th/ 347
METRIC RANK
7.2%
UNEMPLOYMENT AMONG AGES 30 TO 34 YEARS
0.0/ 100
METRIC RATING
322nd/ 347
METRIC RANK
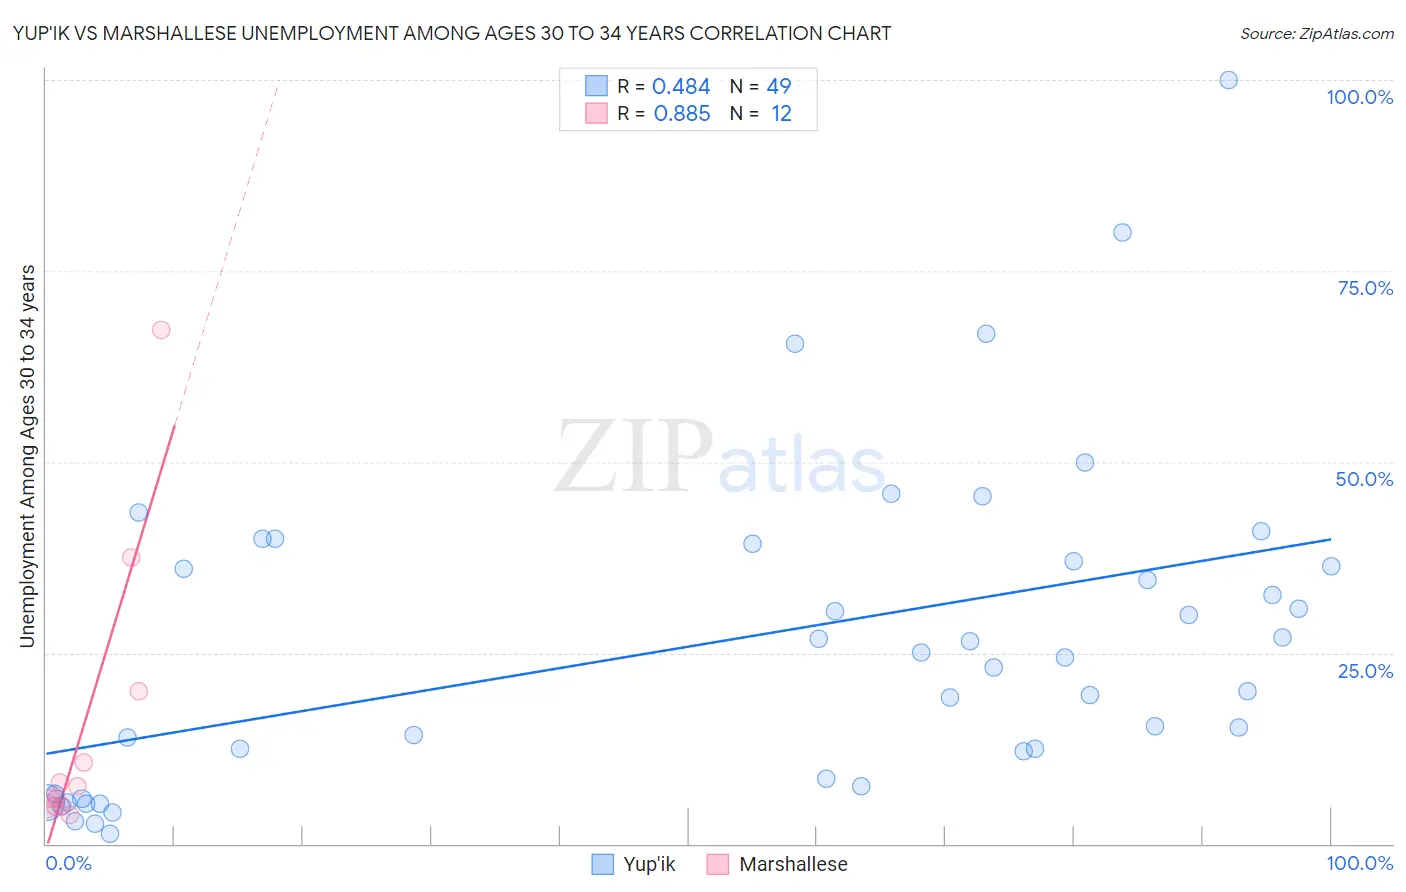
Yup'ik vs Marshallese Unemployment Among Ages 30 to 34 years Correlation Chart
The statistical analysis conducted on geographies consisting of 39,304,366 people shows a moderate positive correlation between the proportion of Yup'ik and unemployment rate among population between the ages 30 and 34 in the United States with a correlation coefficient (R) of 0.484 and weighted average of 18.5%. Similarly, the statistical analysis conducted on geographies consisting of 14,614,488 people shows a very strong positive correlation between the proportion of Marshallese and unemployment rate among population between the ages 30 and 34 in the United States with a correlation coefficient (R) of 0.885 and weighted average of 7.2%, a difference of 155.0%.
Unemployment Among Ages 30 to 34 years Correlation Summary
| Measurement | Yup'ik | Marshallese |
| Minimum | 1.3% | 3.8% |
| Maximum | 100.0% | 67.2% |
| Range | 98.7% | 63.4% |
| Mean | 26.5% | 15.1% |
| Median | 24.5% | 6.8% |
| Interquartile 25% (IQ1) | 8.1% | 4.9% |
| Interquartile 75% (IQ3) | 38.1% | 15.3% |
| Interquartile Range (IQR) | 30.1% | 10.4% |
| Standard Deviation (Sample) | 21.2% | 19.0% |
| Standard Deviation (Population) | 20.9% | 18.2% |
Similar Demographics by Unemployment Among Ages 30 to 34 years
Demographics Similar to Yup'ik by Unemployment Among Ages 30 to 34 years
In terms of unemployment among ages 30 to 34 years, the demographic groups most similar to Yup'ik are Tsimshian (13.8%, a difference of 34.2%), Arapaho (12.8%, a difference of 44.1%), Hopi (11.9%, a difference of 54.7%), Inupiat (10.8%, a difference of 70.7%), and Yuman (10.6%, a difference of 74.3%).
| Demographics | Rating | Rank | Unemployment Among Ages 30 to 34 years |
| Pueblo | 0.0 /100 | #333 | Tragic 8.3% |
| Alaska Natives | 0.0 /100 | #334 | Tragic 8.5% |
| Puerto Ricans | 0.0 /100 | #335 | Tragic 8.9% |
| Colville | 0.0 /100 | #336 | Tragic 9.0% |
| Pima | 0.0 /100 | #337 | Tragic 9.6% |
| Yakama | 0.0 /100 | #338 | Tragic 9.8% |
| Tohono O'odham | 0.0 /100 | #339 | Tragic 9.8% |
| Crow | 0.0 /100 | #340 | Tragic 10.3% |
| Navajo | 0.0 /100 | #341 | Tragic 10.6% |
| Yuman | 0.0 /100 | #342 | Tragic 10.6% |
| Inupiat | 0.0 /100 | #343 | Tragic 10.8% |
| Hopi | 0.0 /100 | #344 | Tragic 11.9% |
| Arapaho | 0.0 /100 | #345 | Tragic 12.8% |
| Tsimshian | 0.0 /100 | #346 | Tragic 13.8% |
| Yup'ik | 0.0 /100 | #347 | Tragic 18.5% |
Demographics Similar to Marshallese by Unemployment Among Ages 30 to 34 years
In terms of unemployment among ages 30 to 34 years, the demographic groups most similar to Marshallese are Immigrants from Yemen (7.3%, a difference of 0.46%), Immigrants from Guyana (7.2%, a difference of 0.50%), Cape Verdean (7.2%, a difference of 0.79%), Guyanese (7.2%, a difference of 0.81%), and Black/African American (7.2%, a difference of 0.88%).
| Demographics | Rating | Rank | Unemployment Among Ages 30 to 34 years |
| Aleuts | 0.0 /100 | #315 | Tragic 7.1% |
| Houma | 0.0 /100 | #316 | Tragic 7.2% |
| Immigrants | Cabo Verde | 0.0 /100 | #317 | Tragic 7.2% |
| Blacks/African Americans | 0.0 /100 | #318 | Tragic 7.2% |
| Guyanese | 0.0 /100 | #319 | Tragic 7.2% |
| Cape Verdeans | 0.0 /100 | #320 | Tragic 7.2% |
| Immigrants | Guyana | 0.0 /100 | #321 | Tragic 7.2% |
| Marshallese | 0.0 /100 | #322 | Tragic 7.2% |
| Immigrants | Yemen | 0.0 /100 | #323 | Tragic 7.3% |
| Immigrants | Dominica | 0.0 /100 | #324 | Tragic 7.3% |
| Apache | 0.0 /100 | #325 | Tragic 7.3% |
| Dominicans | 0.0 /100 | #326 | Tragic 7.7% |
| Immigrants | Dominican Republic | 0.0 /100 | #327 | Tragic 7.7% |
| Chippewa | 0.0 /100 | #328 | Tragic 7.8% |
| Cheyenne | 0.0 /100 | #329 | Tragic 7.8% |