Yup'ik vs Czech Unemployment Among Ages 30 to 34 years
COMPARE
Yup'ik
Czech
Unemployment Among Ages 30 to 34 years
Unemployment Among Ages 30 to 34 years Comparison
Yup'ik
Czechs
18.5%
UNEMPLOYMENT AMONG AGES 30 TO 34 YEARS
0.0/ 100
METRIC RATING
347th/ 347
METRIC RANK
5.0%
UNEMPLOYMENT AMONG AGES 30 TO 34 YEARS
99.2/ 100
METRIC RATING
36th/ 347
METRIC RANK
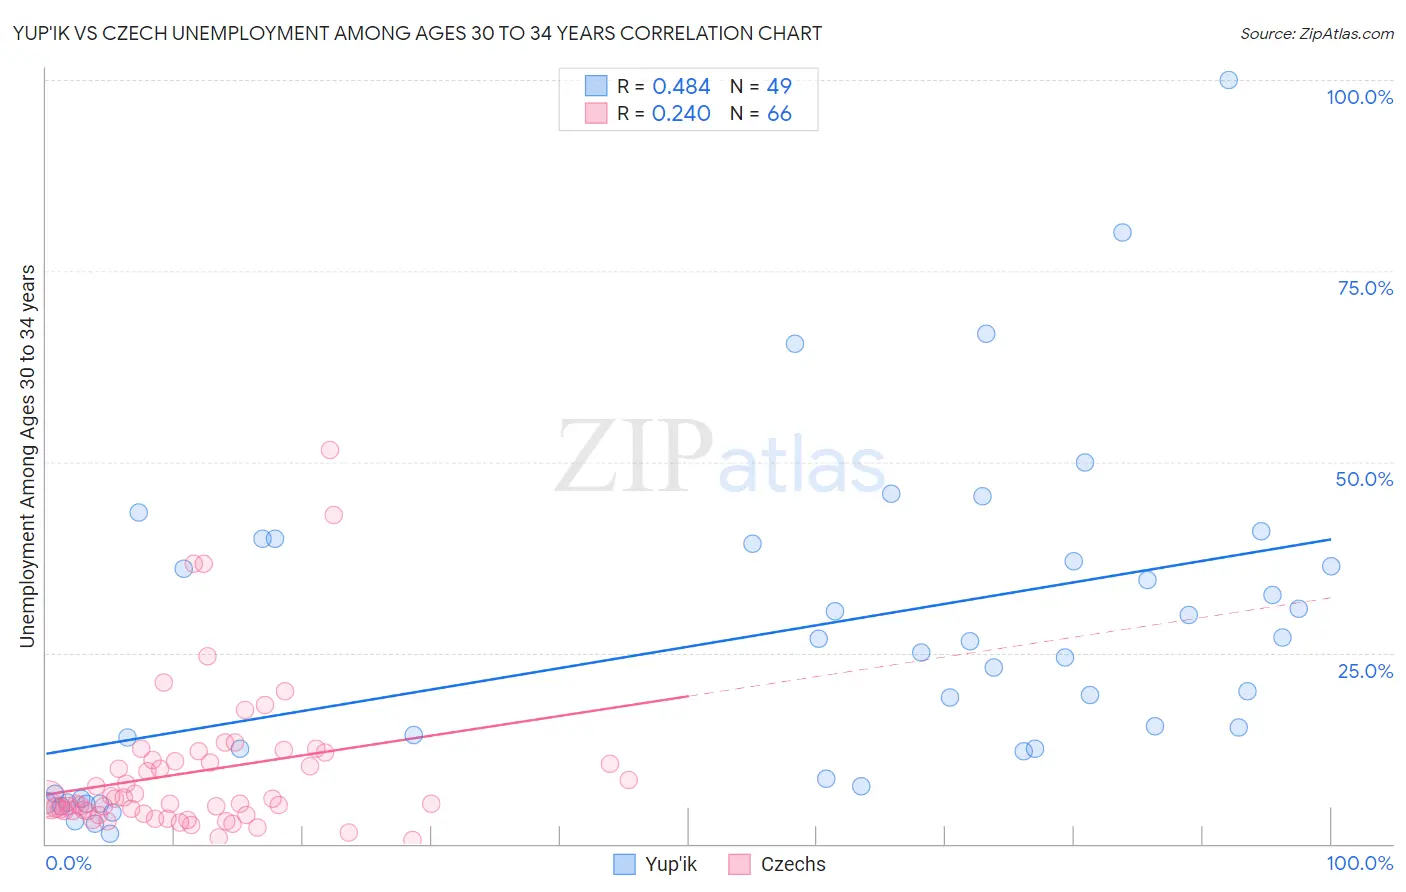
Yup'ik vs Czech Unemployment Among Ages 30 to 34 years Correlation Chart
The statistical analysis conducted on geographies consisting of 39,304,366 people shows a moderate positive correlation between the proportion of Yup'ik and unemployment rate among population between the ages 30 and 34 in the United States with a correlation coefficient (R) of 0.484 and weighted average of 18.5%. Similarly, the statistical analysis conducted on geographies consisting of 438,540,719 people shows a weak positive correlation between the proportion of Czechs and unemployment rate among population between the ages 30 and 34 in the United States with a correlation coefficient (R) of 0.240 and weighted average of 5.0%, a difference of 268.7%.
Unemployment Among Ages 30 to 34 years Correlation Summary
| Measurement | Yup'ik | Czech |
| Minimum | 1.3% | 0.50% |
| Maximum | 100.0% | 51.6% |
| Range | 98.7% | 51.1% |
| Mean | 26.5% | 9.5% |
| Median | 24.5% | 5.6% |
| Interquartile 25% (IQ1) | 8.1% | 4.2% |
| Interquartile 75% (IQ3) | 38.1% | 11.0% |
| Interquartile Range (IQR) | 30.1% | 6.7% |
| Standard Deviation (Sample) | 21.2% | 9.8% |
| Standard Deviation (Population) | 20.9% | 9.7% |
Similar Demographics by Unemployment Among Ages 30 to 34 years
Demographics Similar to Yup'ik by Unemployment Among Ages 30 to 34 years
In terms of unemployment among ages 30 to 34 years, the demographic groups most similar to Yup'ik are Tsimshian (13.8%, a difference of 34.2%), Arapaho (12.8%, a difference of 44.1%), Hopi (11.9%, a difference of 54.7%), Inupiat (10.8%, a difference of 70.7%), and Yuman (10.6%, a difference of 74.3%).
| Demographics | Rating | Rank | Unemployment Among Ages 30 to 34 years |
| Pueblo | 0.0 /100 | #333 | Tragic 8.3% |
| Alaska Natives | 0.0 /100 | #334 | Tragic 8.5% |
| Puerto Ricans | 0.0 /100 | #335 | Tragic 8.9% |
| Colville | 0.0 /100 | #336 | Tragic 9.0% |
| Pima | 0.0 /100 | #337 | Tragic 9.6% |
| Yakama | 0.0 /100 | #338 | Tragic 9.8% |
| Tohono O'odham | 0.0 /100 | #339 | Tragic 9.8% |
| Crow | 0.0 /100 | #340 | Tragic 10.3% |
| Navajo | 0.0 /100 | #341 | Tragic 10.6% |
| Yuman | 0.0 /100 | #342 | Tragic 10.6% |
| Inupiat | 0.0 /100 | #343 | Tragic 10.8% |
| Hopi | 0.0 /100 | #344 | Tragic 11.9% |
| Arapaho | 0.0 /100 | #345 | Tragic 12.8% |
| Tsimshian | 0.0 /100 | #346 | Tragic 13.8% |
| Yup'ik | 0.0 /100 | #347 | Tragic 18.5% |
Demographics Similar to Czechs by Unemployment Among Ages 30 to 34 years
In terms of unemployment among ages 30 to 34 years, the demographic groups most similar to Czechs are Immigrants from Ethiopia (5.0%, a difference of 0.040%), Immigrants from Turkey (5.0%, a difference of 0.25%), Sri Lankan (5.0%, a difference of 0.25%), Latvian (5.0%, a difference of 0.28%), and Immigrants from Saudi Arabia (5.0%, a difference of 0.32%).
| Demographics | Rating | Rank | Unemployment Among Ages 30 to 34 years |
| German Russians | 99.4 /100 | #29 | Exceptional 5.0% |
| Norwegians | 99.4 /100 | #30 | Exceptional 5.0% |
| Somalis | 99.3 /100 | #31 | Exceptional 5.0% |
| Immigrants | Zaire | 99.3 /100 | #32 | Exceptional 5.0% |
| Immigrants | Saudi Arabia | 99.3 /100 | #33 | Exceptional 5.0% |
| Latvians | 99.3 /100 | #34 | Exceptional 5.0% |
| Immigrants | Ethiopia | 99.2 /100 | #35 | Exceptional 5.0% |
| Czechs | 99.2 /100 | #36 | Exceptional 5.0% |
| Immigrants | Turkey | 99.0 /100 | #37 | Exceptional 5.0% |
| Sri Lankans | 99.0 /100 | #38 | Exceptional 5.0% |
| Fijians | 99.0 /100 | #39 | Exceptional 5.0% |
| Immigrants | Vietnam | 98.9 /100 | #40 | Exceptional 5.0% |
| Immigrants | Eastern Africa | 98.9 /100 | #41 | Exceptional 5.0% |
| Immigrants | Hong Kong | 98.8 /100 | #42 | Exceptional 5.0% |
| Soviet Union | 98.8 /100 | #43 | Exceptional 5.0% |