Immigrants from Moldova vs Immigrants from Ecuador Unemployment Among Ages 30 to 34 years
COMPARE
Immigrants from Moldova
Immigrants from Ecuador
Unemployment Among Ages 30 to 34 years
Unemployment Among Ages 30 to 34 years Comparison
Immigrants from Moldova
Immigrants from Ecuador
5.1%
UNEMPLOYMENT AMONG AGES 30 TO 34 YEARS
96.4/ 100
METRIC RATING
72nd/ 347
METRIC RANK
6.3%
UNEMPLOYMENT AMONG AGES 30 TO 34 YEARS
0.0/ 100
METRIC RATING
277th/ 347
METRIC RANK
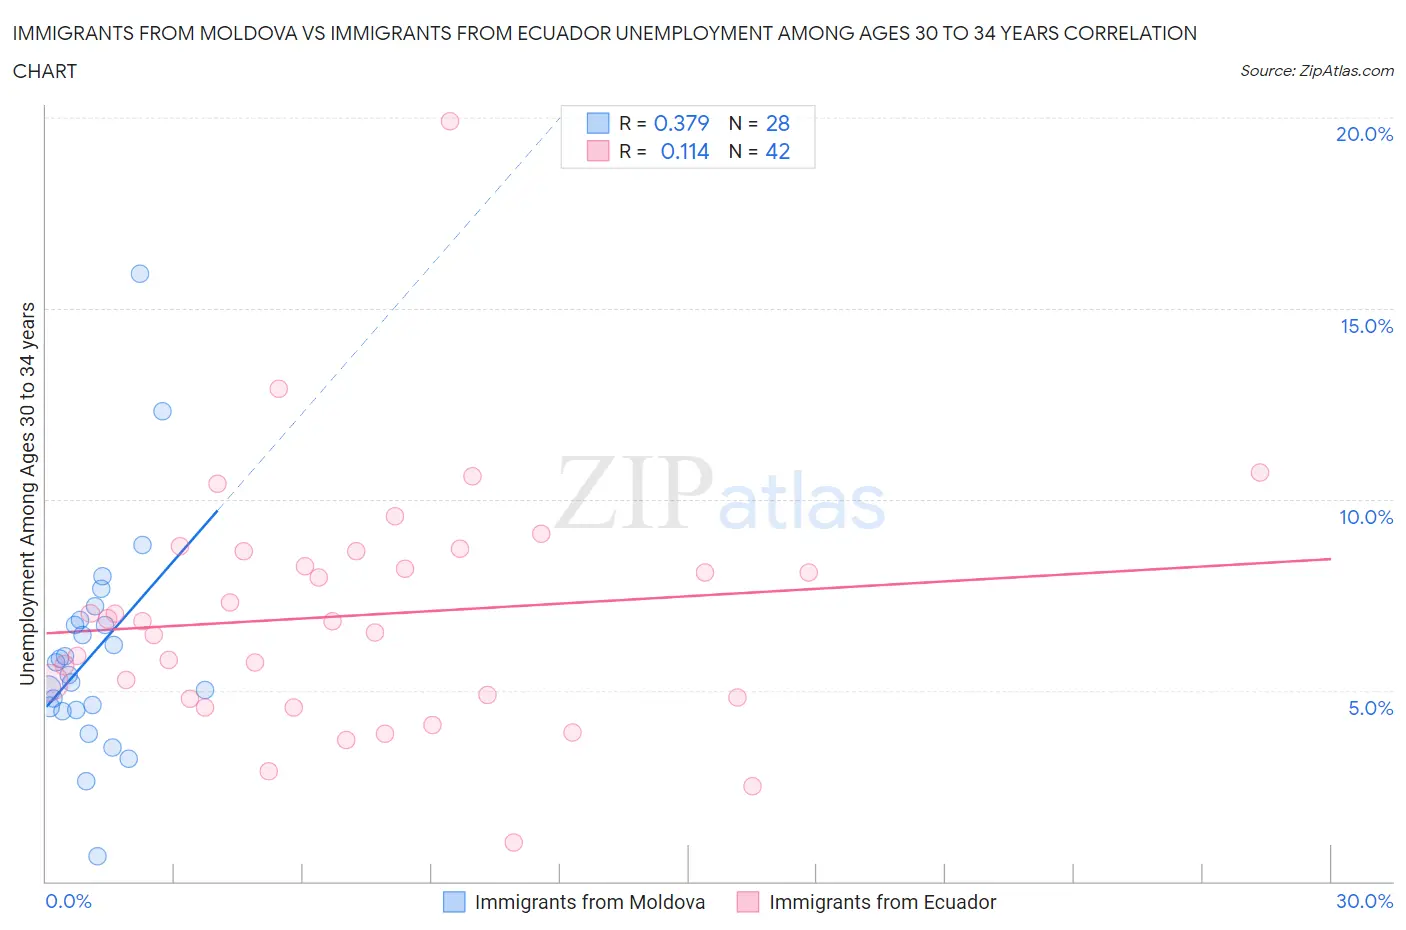
Immigrants from Moldova vs Immigrants from Ecuador Unemployment Among Ages 30 to 34 years Correlation Chart
The statistical analysis conducted on geographies consisting of 121,793,876 people shows a mild positive correlation between the proportion of Immigrants from Moldova and unemployment rate among population between the ages 30 and 34 in the United States with a correlation coefficient (R) of 0.379 and weighted average of 5.1%. Similarly, the statistical analysis conducted on geographies consisting of 261,488,885 people shows a poor positive correlation between the proportion of Immigrants from Ecuador and unemployment rate among population between the ages 30 and 34 in the United States with a correlation coefficient (R) of 0.114 and weighted average of 6.3%, a difference of 23.0%.
Unemployment Among Ages 30 to 34 years Correlation Summary
| Measurement | Immigrants from Moldova | Immigrants from Ecuador |
| Minimum | 0.66% | 1.0% |
| Maximum | 15.9% | 19.9% |
| Range | 15.2% | 18.9% |
| Mean | 6.0% | 7.0% |
| Median | 5.6% | 6.8% |
| Interquartile 25% (IQ1) | 4.5% | 4.8% |
| Interquartile 75% (IQ3) | 6.8% | 8.6% |
| Interquartile Range (IQR) | 2.3% | 3.8% |
| Standard Deviation (Sample) | 2.9% | 3.2% |
| Standard Deviation (Population) | 2.9% | 3.2% |
Similar Demographics by Unemployment Among Ages 30 to 34 years
Demographics Similar to Immigrants from Moldova by Unemployment Among Ages 30 to 34 years
In terms of unemployment among ages 30 to 34 years, the demographic groups most similar to Immigrants from Moldova are Paraguayan (5.1%, a difference of 0.010%), Immigrants from Northern Africa (5.1%, a difference of 0.020%), Immigrants from Iraq (5.1%, a difference of 0.020%), Jordanian (5.1%, a difference of 0.030%), and Burmese (5.1%, a difference of 0.040%).
| Demographics | Rating | Rank | Unemployment Among Ages 30 to 34 years |
| Immigrants | Japan | 96.8 /100 | #65 | Exceptional 5.1% |
| Immigrants | Zimbabwe | 96.7 /100 | #66 | Exceptional 5.1% |
| Burmese | 96.5 /100 | #67 | Exceptional 5.1% |
| Jordanians | 96.5 /100 | #68 | Exceptional 5.1% |
| Immigrants | Northern Africa | 96.4 /100 | #69 | Exceptional 5.1% |
| Immigrants | Iraq | 96.4 /100 | #70 | Exceptional 5.1% |
| Paraguayans | 96.4 /100 | #71 | Exceptional 5.1% |
| Immigrants | Moldova | 96.4 /100 | #72 | Exceptional 5.1% |
| Slovenes | 96.2 /100 | #73 | Exceptional 5.2% |
| Immigrants | Asia | 96.2 /100 | #74 | Exceptional 5.2% |
| Iranians | 96.0 /100 | #75 | Exceptional 5.2% |
| Scandinavians | 95.6 /100 | #76 | Exceptional 5.2% |
| Uruguayans | 95.4 /100 | #77 | Exceptional 5.2% |
| Indonesians | 95.1 /100 | #78 | Exceptional 5.2% |
| Immigrants | Lithuania | 95.0 /100 | #79 | Exceptional 5.2% |
Demographics Similar to Immigrants from Ecuador by Unemployment Among Ages 30 to 34 years
In terms of unemployment among ages 30 to 34 years, the demographic groups most similar to Immigrants from Ecuador are Osage (6.3%, a difference of 0.080%), Cree (6.4%, a difference of 0.56%), Cherokee (6.4%, a difference of 0.61%), Pennsylvania German (6.3%, a difference of 0.73%), and Ecuadorian (6.3%, a difference of 0.79%).
| Demographics | Rating | Rank | Unemployment Among Ages 30 to 34 years |
| Immigrants | Senegal | 0.0 /100 | #270 | Tragic 6.3% |
| Comanche | 0.0 /100 | #271 | Tragic 6.3% |
| Blackfeet | 0.0 /100 | #272 | Tragic 6.3% |
| Ottawa | 0.0 /100 | #273 | Tragic 6.3% |
| U.S. Virgin Islanders | 0.0 /100 | #274 | Tragic 6.3% |
| Ecuadorians | 0.0 /100 | #275 | Tragic 6.3% |
| Pennsylvania Germans | 0.0 /100 | #276 | Tragic 6.3% |
| Immigrants | Ecuador | 0.0 /100 | #277 | Tragic 6.3% |
| Osage | 0.0 /100 | #278 | Tragic 6.3% |
| Cree | 0.0 /100 | #279 | Tragic 6.4% |
| Cherokee | 0.0 /100 | #280 | Tragic 6.4% |
| Immigrants | Caribbean | 0.0 /100 | #281 | Tragic 6.4% |
| Africans | 0.0 /100 | #282 | Tragic 6.4% |
| Hispanics or Latinos | 0.0 /100 | #283 | Tragic 6.4% |
| Immigrants | Bangladesh | 0.0 /100 | #284 | Tragic 6.4% |