Yakama vs Immigrants from Eastern Asia Male Unemployment
COMPARE
Yakama
Immigrants from Eastern Asia
Male Unemployment
Male Unemployment Comparison
Yakama
Immigrants from Eastern Asia
7.9%
MALE UNEMPLOYMENT
0.0/ 100
METRIC RATING
330th/ 347
METRIC RANK
5.1%
MALE UNEMPLOYMENT
90.8/ 100
METRIC RATING
111th/ 347
METRIC RANK
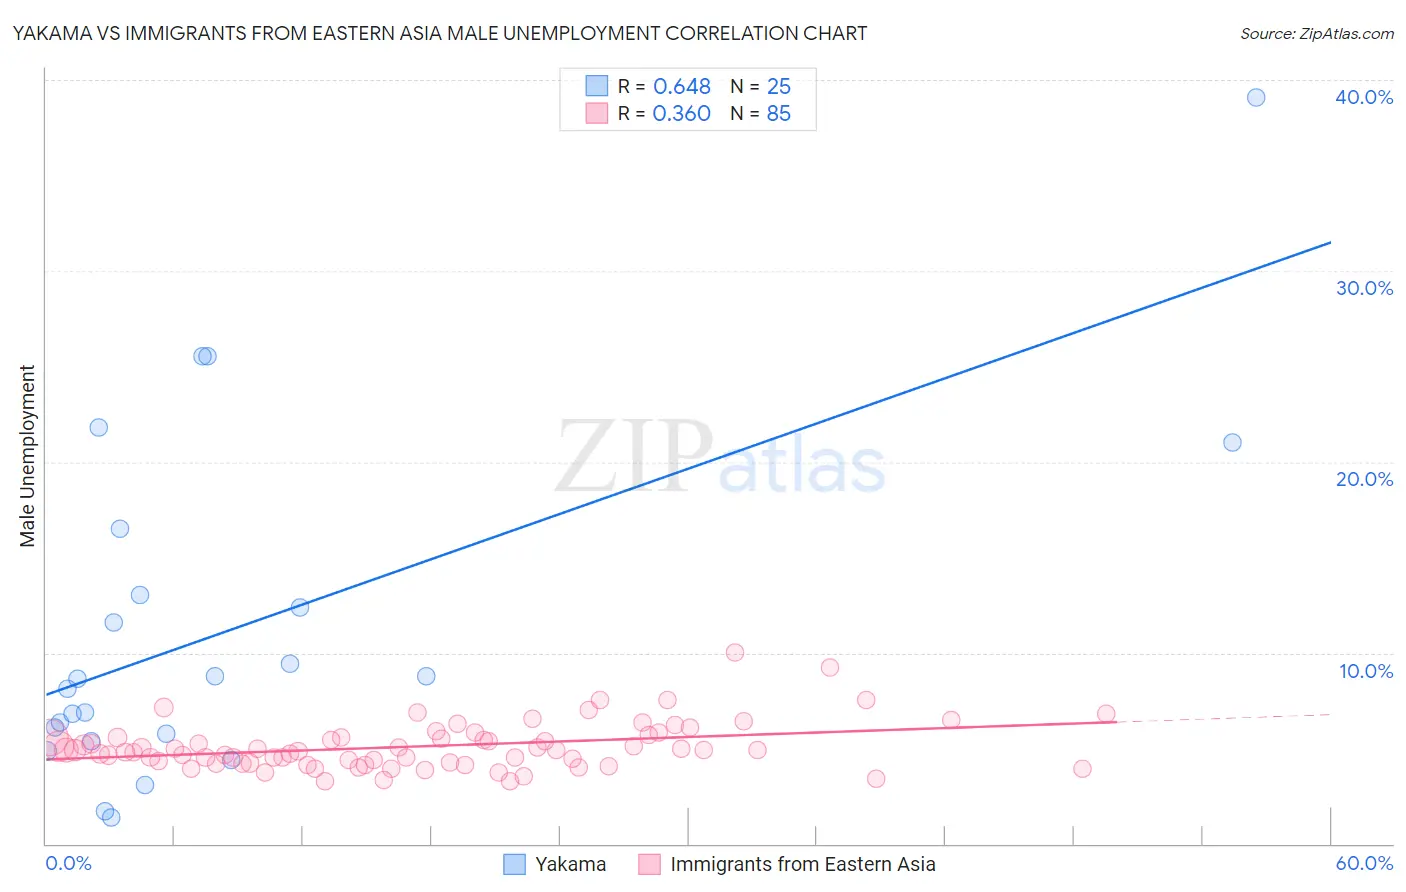
Yakama vs Immigrants from Eastern Asia Male Unemployment Correlation Chart
The statistical analysis conducted on geographies consisting of 19,892,932 people shows a significant positive correlation between the proportion of Yakama and unemployment rate among males in the United States with a correlation coefficient (R) of 0.648 and weighted average of 7.9%. Similarly, the statistical analysis conducted on geographies consisting of 496,101,310 people shows a mild positive correlation between the proportion of Immigrants from Eastern Asia and unemployment rate among males in the United States with a correlation coefficient (R) of 0.360 and weighted average of 5.1%, a difference of 54.9%.
Male Unemployment Correlation Summary
| Measurement | Yakama | Immigrants from Eastern Asia |
| Minimum | 1.4% | 3.2% |
| Maximum | 39.1% | 10.0% |
| Range | 37.7% | 6.8% |
| Mean | 11.3% | 5.1% |
| Median | 8.7% | 4.9% |
| Interquartile 25% (IQ1) | 5.5% | 4.2% |
| Interquartile 75% (IQ3) | 14.7% | 5.6% |
| Interquartile Range (IQR) | 9.2% | 1.4% |
| Standard Deviation (Sample) | 9.0% | 1.2% |
| Standard Deviation (Population) | 8.8% | 1.2% |
Similar Demographics by Male Unemployment
Demographics Similar to Yakama by Male Unemployment
In terms of male unemployment, the demographic groups most similar to Yakama are Immigrants from Yemen (7.8%, a difference of 1.8%), Alaska Native (8.1%, a difference of 1.9%), Native/Alaskan (7.7%, a difference of 2.7%), Paiute (7.7%, a difference of 3.1%), and Immigrants from Dominican Republic (7.6%, a difference of 4.2%).
| Demographics | Rating | Rank | Male Unemployment |
| Immigrants | Grenada | 0.0 /100 | #323 | Tragic 7.6% |
| Dominicans | 0.0 /100 | #324 | Tragic 7.6% |
| Shoshone | 0.0 /100 | #325 | Tragic 7.6% |
| Immigrants | Dominican Republic | 0.0 /100 | #326 | Tragic 7.6% |
| Paiute | 0.0 /100 | #327 | Tragic 7.7% |
| Natives/Alaskans | 0.0 /100 | #328 | Tragic 7.7% |
| Immigrants | Yemen | 0.0 /100 | #329 | Tragic 7.8% |
| Yakama | 0.0 /100 | #330 | Tragic 7.9% |
| Alaska Natives | 0.0 /100 | #331 | Tragic 8.1% |
| Pima | 0.0 /100 | #332 | Tragic 8.3% |
| Sioux | 0.0 /100 | #333 | Tragic 8.4% |
| Tsimshian | 0.0 /100 | #334 | Tragic 8.5% |
| Pueblo | 0.0 /100 | #335 | Tragic 8.5% |
| Yuman | 0.0 /100 | #336 | Tragic 8.6% |
| Puerto Ricans | 0.0 /100 | #337 | Tragic 8.6% |
Demographics Similar to Immigrants from Eastern Asia by Male Unemployment
In terms of male unemployment, the demographic groups most similar to Immigrants from Eastern Asia are Immigrants from England (5.1%, a difference of 0.010%), Immigrants from Pakistan (5.1%, a difference of 0.030%), Immigrants from Moldova (5.1%, a difference of 0.080%), Immigrants from Nicaragua (5.1%, a difference of 0.090%), and Immigrants from Austria (5.1%, a difference of 0.090%).
| Demographics | Rating | Rank | Male Unemployment |
| Immigrants | Chile | 91.8 /100 | #104 | Exceptional 5.1% |
| Immigrants | Czechoslovakia | 91.7 /100 | #105 | Exceptional 5.1% |
| Immigrants | Ethiopia | 91.5 /100 | #106 | Exceptional 5.1% |
| Ethiopians | 91.3 /100 | #107 | Exceptional 5.1% |
| Immigrants | Nicaragua | 91.2 /100 | #108 | Exceptional 5.1% |
| Immigrants | Pakistan | 90.9 /100 | #109 | Exceptional 5.1% |
| Immigrants | England | 90.8 /100 | #110 | Exceptional 5.1% |
| Immigrants | Eastern Asia | 90.8 /100 | #111 | Exceptional 5.1% |
| Immigrants | Moldova | 90.3 /100 | #112 | Exceptional 5.1% |
| Immigrants | Austria | 90.3 /100 | #113 | Exceptional 5.1% |
| Romanians | 89.8 /100 | #114 | Excellent 5.1% |
| Immigrants | Asia | 89.6 /100 | #115 | Excellent 5.1% |
| Immigrants | Denmark | 89.4 /100 | #116 | Excellent 5.1% |
| Estonians | 89.0 /100 | #117 | Excellent 5.1% |
| Cypriots | 88.8 /100 | #118 | Excellent 5.1% |