White/Caucasian vs Latvian Unemployment
COMPARE
White/Caucasian
Latvian
Unemployment
Unemployment Comparison
Whites/Caucasians
Latvians
4.9%
UNEMPLOYMENT
99.2/ 100
METRIC RATING
52nd/ 347
METRIC RANK
4.7%
UNEMPLOYMENT
99.9/ 100
METRIC RATING
25th/ 347
METRIC RANK
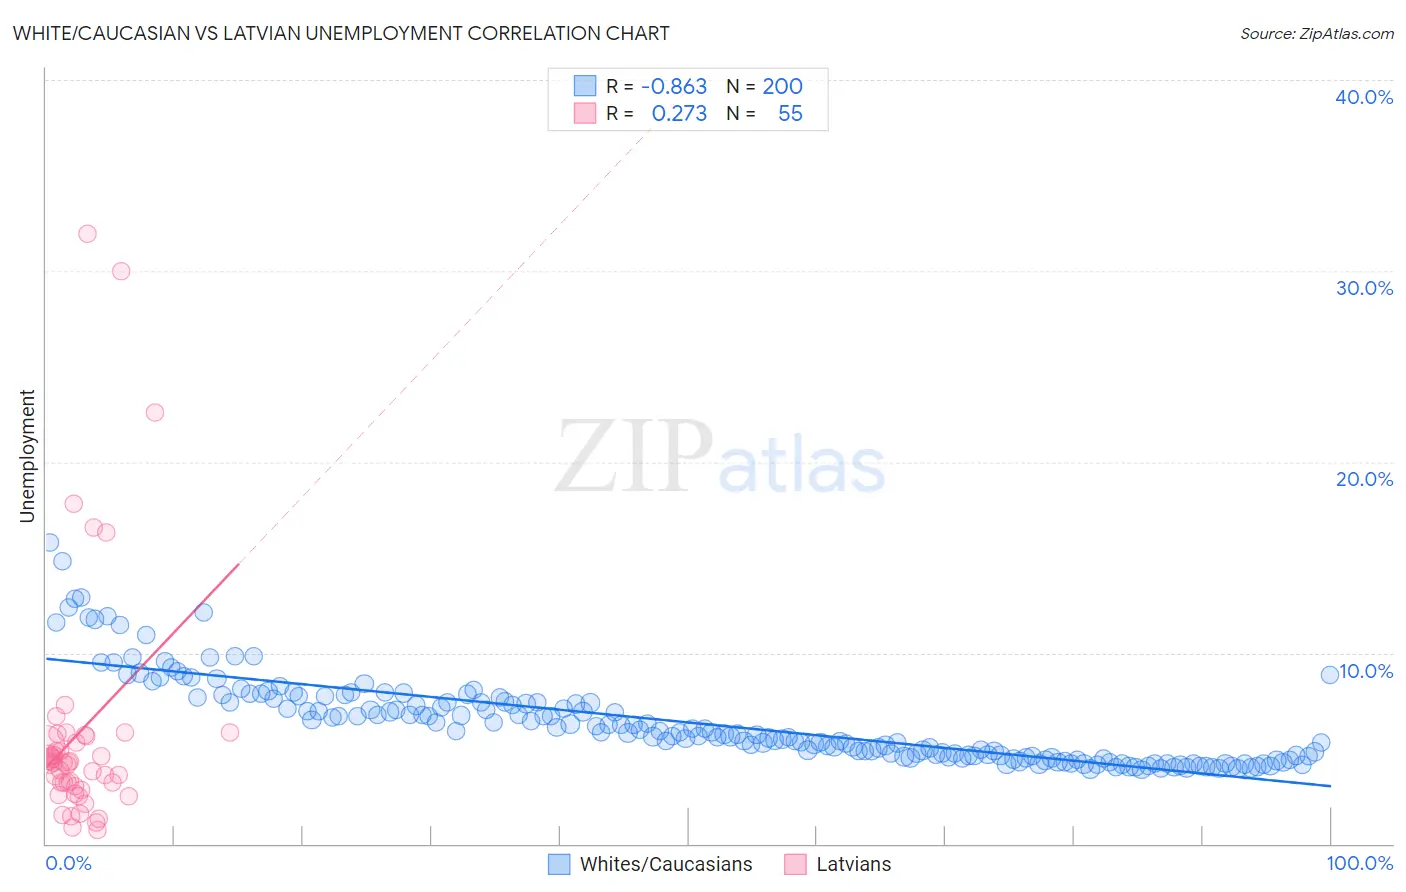
White/Caucasian vs Latvian Unemployment Correlation Chart
The statistical analysis conducted on geographies consisting of 578,869,025 people shows a very strong negative correlation between the proportion of Whites/Caucasians and unemployment in the United States with a correlation coefficient (R) of -0.863 and weighted average of 4.9%. Similarly, the statistical analysis conducted on geographies consisting of 220,638,236 people shows a weak positive correlation between the proportion of Latvians and unemployment in the United States with a correlation coefficient (R) of 0.273 and weighted average of 4.7%, a difference of 3.3%.
Unemployment Correlation Summary
| Measurement | White/Caucasian | Latvian |
| Minimum | 3.9% | 0.70% |
| Maximum | 15.8% | 32.0% |
| Range | 11.9% | 31.3% |
| Mean | 6.3% | 5.9% |
| Median | 5.8% | 4.3% |
| Interquartile 25% (IQ1) | 4.6% | 3.0% |
| Interquartile 75% (IQ3) | 7.4% | 5.6% |
| Interquartile Range (IQR) | 2.8% | 2.6% |
| Standard Deviation (Sample) | 2.2% | 6.4% |
| Standard Deviation (Population) | 2.2% | 6.4% |
Similar Demographics by Unemployment
Demographics Similar to Whites/Caucasians by Unemployment
In terms of unemployment, the demographic groups most similar to Whites/Caucasians are Immigrants from Belgium (4.9%, a difference of 0.010%), Immigrants from Zimbabwe (4.9%, a difference of 0.030%), Eastern European (4.9%, a difference of 0.060%), Australian (4.9%, a difference of 0.090%), and French Canadian (4.9%, a difference of 0.17%).
| Demographics | Rating | Rank | Unemployment |
| French | 99.5 /100 | #45 | Exceptional 4.8% |
| Immigrants | Nepal | 99.4 /100 | #46 | Exceptional 4.8% |
| Immigrants | Taiwan | 99.4 /100 | #47 | Exceptional 4.8% |
| Immigrants | Scotland | 99.3 /100 | #48 | Exceptional 4.9% |
| Immigrants | South Central Asia | 99.3 /100 | #49 | Exceptional 4.9% |
| French Canadians | 99.3 /100 | #50 | Exceptional 4.9% |
| Immigrants | Belgium | 99.2 /100 | #51 | Exceptional 4.9% |
| Whites/Caucasians | 99.2 /100 | #52 | Exceptional 4.9% |
| Immigrants | Zimbabwe | 99.2 /100 | #53 | Exceptional 4.9% |
| Eastern Europeans | 99.2 /100 | #54 | Exceptional 4.9% |
| Australians | 99.2 /100 | #55 | Exceptional 4.9% |
| Celtics | 99.1 /100 | #56 | Exceptional 4.9% |
| Immigrants | Singapore | 99.1 /100 | #57 | Exceptional 4.9% |
| Greeks | 99.0 /100 | #58 | Exceptional 4.9% |
| Bhutanese | 99.0 /100 | #59 | Exceptional 4.9% |
Demographics Similar to Latvians by Unemployment
In terms of unemployment, the demographic groups most similar to Latvians are Bulgarian (4.7%, a difference of 0.040%), Venezuelan (4.7%, a difference of 0.070%), British (4.7%, a difference of 0.15%), Finnish (4.7%, a difference of 0.25%), and Welsh (4.7%, a difference of 0.45%).
| Demographics | Rating | Rank | Unemployment |
| Immigrants | Venezuela | 99.9 /100 | #18 | Exceptional 4.7% |
| Scottish | 99.9 /100 | #19 | Exceptional 4.7% |
| Carpatho Rusyns | 99.9 /100 | #20 | Exceptional 4.7% |
| Welsh | 99.9 /100 | #21 | Exceptional 4.7% |
| Thais | 99.9 /100 | #22 | Exceptional 4.7% |
| British | 99.9 /100 | #23 | Exceptional 4.7% |
| Venezuelans | 99.9 /100 | #24 | Exceptional 4.7% |
| Latvians | 99.9 /100 | #25 | Exceptional 4.7% |
| Bulgarians | 99.9 /100 | #26 | Exceptional 4.7% |
| Finns | 99.9 /100 | #27 | Exceptional 4.7% |
| Cubans | 99.8 /100 | #28 | Exceptional 4.7% |
| Poles | 99.8 /100 | #29 | Exceptional 4.7% |
| Irish | 99.8 /100 | #30 | Exceptional 4.8% |
| Croatians | 99.8 /100 | #31 | Exceptional 4.8% |
| Zimbabweans | 99.8 /100 | #32 | Exceptional 4.8% |